Is flow decorrelation due to the twist effect?
In the Collaboration meeting, several studies on flow decorrelations are presented including the one by Zhenyu Chen and me. In our analysis, we use the Qvector methods:
In this study, I used the same cuts and centrality definitions as specified by used in The Event plane angles (Psi) of EPD are obtained from the StEpdEpFinder. They are Phi weighted and Psi shifted. As for the TPC EP, it is calculated from the Qvectors and has a magnitude between 0 and Pi:

In this study, I used 100 runs (about one quarter of all the available data).
.png)
.png)
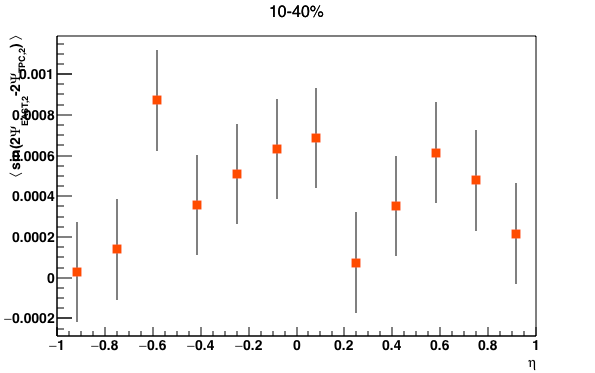
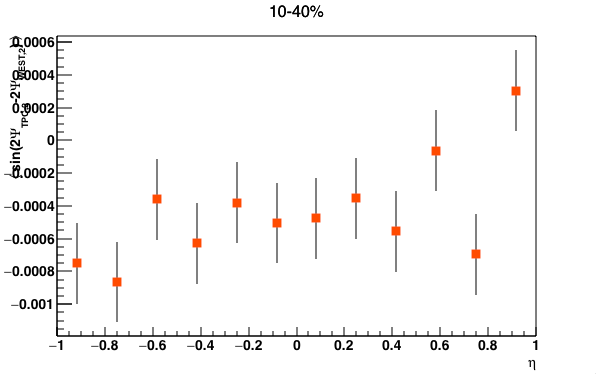


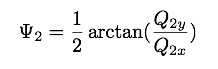
Figure 1 the first column is the "sine sine" plots, the second and third columns are plots for the extraction term. Note they are in different scales, I set the maximum to 0.0 for the <sinesine> plots to show how "negative" they are.
The plots show negative values for the "sine sine" term. The results are surprising to me because it indicates that the twist effect is not dominant in the flow de-correlation. What's more, the negative value suggests that the TPC EPs are always "outside" of the "Psi_EPD_East and Psi_EPD_West range" instead of between the range as the twist effect picture suggests.
----------------------------------------------------Update on May 5th---------------------------------------------------------------
Let me start with the conclusion: it is the poor event plane resolution that leads to the negative <sinesine> values. Here is some study about it.
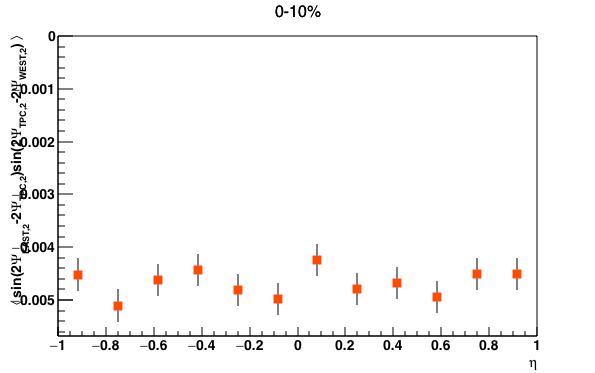
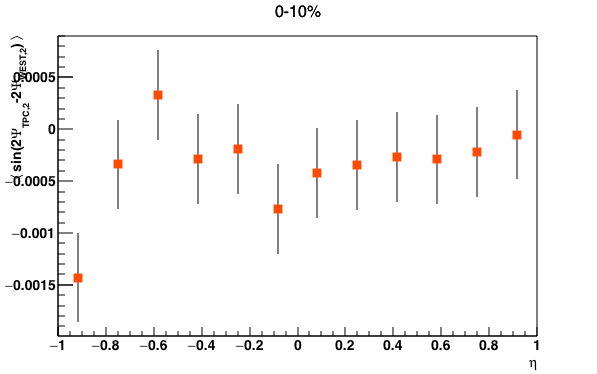
EPD is a very forward detector therefore besides the participants, it also detects the spectators. For the spectators, the evolution of flow will dominate the flow de-correlation instead of the twist effect. If it is why we got a negative <sinesine> signal when using both EPD and TPC, then we should get something different when we only use TPC where the detected particles are mostly from the participants. However, as shown in Figure 2, the signals are even more negative when we use three sub sets of events from the TPC.
.png)
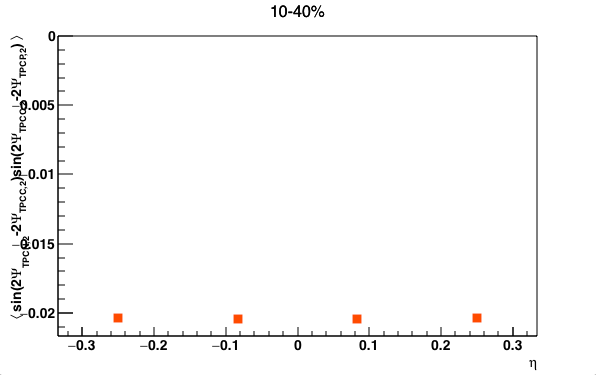
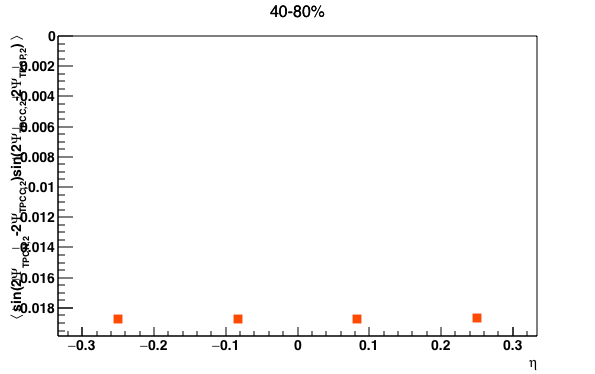
Figure 2: the Y axis is <sin(2A-2C)sin(2C-2B)> where the eta range of A is [-0.83,-0.5], B is [0.5,0.83] and the eta range of C is as shown on the X axis of the plots.
The results indicate that the negative <sinesine> is not due to the participants but it might be due to the poor event plane resolution!
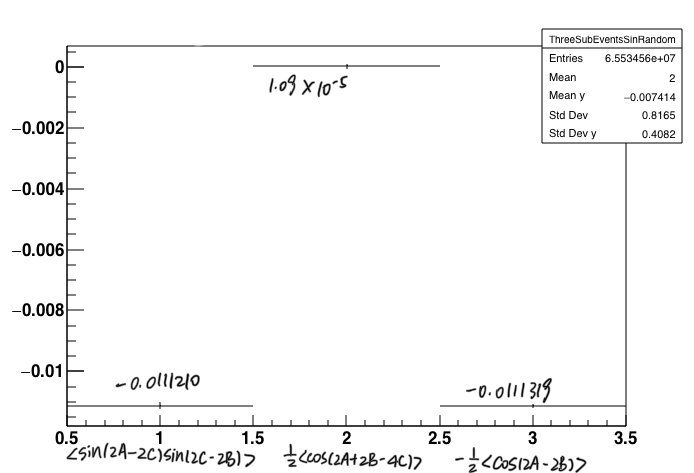
Here is a quick study showing that the low event plane resolution will result in a negative <sinesine> signal (Figure 3). Assume there are three Event Plane angles and all of them are 0. Now I smear them respectively with a random value in the smearing range. The smearing range represents the EP resolution, with a 'perfect' EP resolution, i.e. the smearing range is 0, the <sinesine> term should be 0. As shown in Figure 3, larger smearing angles (worse EP resolutions) lead to more negative <sinesine> values.
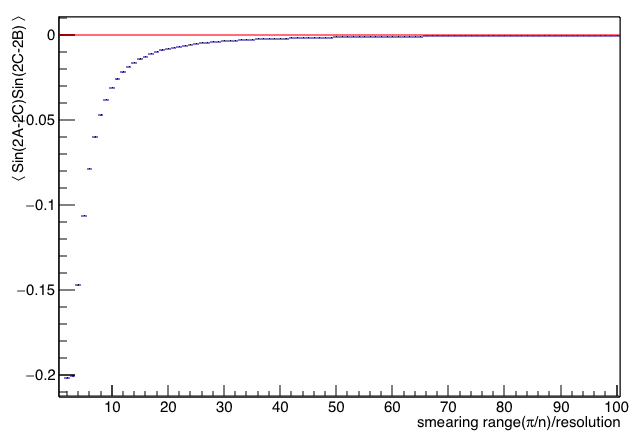
Figure 3 bad EP resolutions lead to negative <sinesine> signals.
Therefore, if the EP resolution is bad, the "positive twist effect signal" will be hidden. This is also why when we only use TPC, we got more negative signals. The TPC was divided into 12 eta bins, compared with the whole EPD, the EP resolutions of the TPC slices are smaller. A quick check is when using the whole TPC (instead of dividing it into 12 slices), <sinesine> should be less negative. Indeed, the value becomes -0.00372442 for 0-10%, -0.00891162 for 10-40% and -0.00783602 for 40-80%, which is consistent with our expectation.
How to account for the bad EP resolution?
I don't know yet. Something might be useful:
![]()
Calculate <sinesine> as well as two terms on the right hand side with A=EPD_EAST, B=EPD_WEST, C=random angle in [0,pi].
- lxy1122's blog
- Login or register to post comments