Run10 Phi ->e+e- embedding QA
First of all, I compare NhitsFit from embedding data and real data with TOF and dEdx PID.
The plots are attached at bottom and they agree very well.
Next, I compare reconstruction efficiency of phi with single electron embedding and phi->ee embedding data. (w/o TOF Matching efficiency and PID cut efficiency)
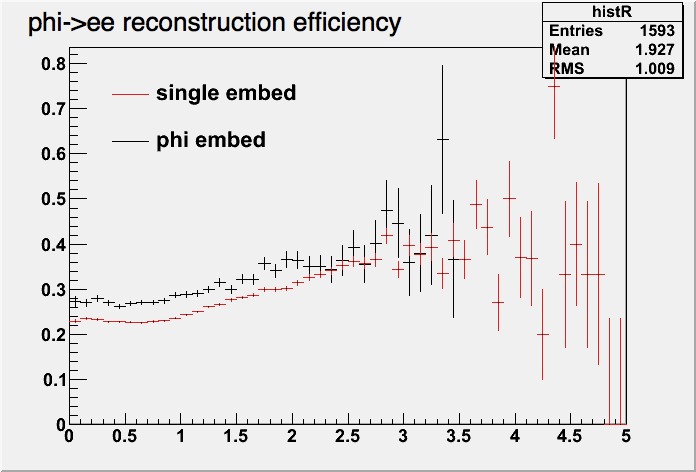
The difference is more than 10%.
I also checked reconstruction efficiency of daughter particles. (included MC daughter tracks into MC tracks in MiniMc file)
There is some dip at pt = 0.4~0.5 GeV/c.
Here is Mc pt distribution and eta vs p distribution of daughter particles.
There is some peak at p=0.5.
It should look like this plot below.
This is Mc eta vs p distribution using the single electron embedding data.
This plot shows Mc and Rc pt distribution with the single electron embedding data.
One thing little bit confusing is that Rc pt distribution with phi->ee embedding looks resonable to me.
Finally, I checked the Mc eta and p distribution of phi from the single electron embedding data.
It looks normal. You can compare this with one in the basic QA.
My conclusion is that there is some thing wrong with decy kinematics in phi->ee embedding.
- masayuki's blog
- Login or register to post comments