Systematical error study for phi->ee in Run10 Au+Au 200GeV
Here is the result.
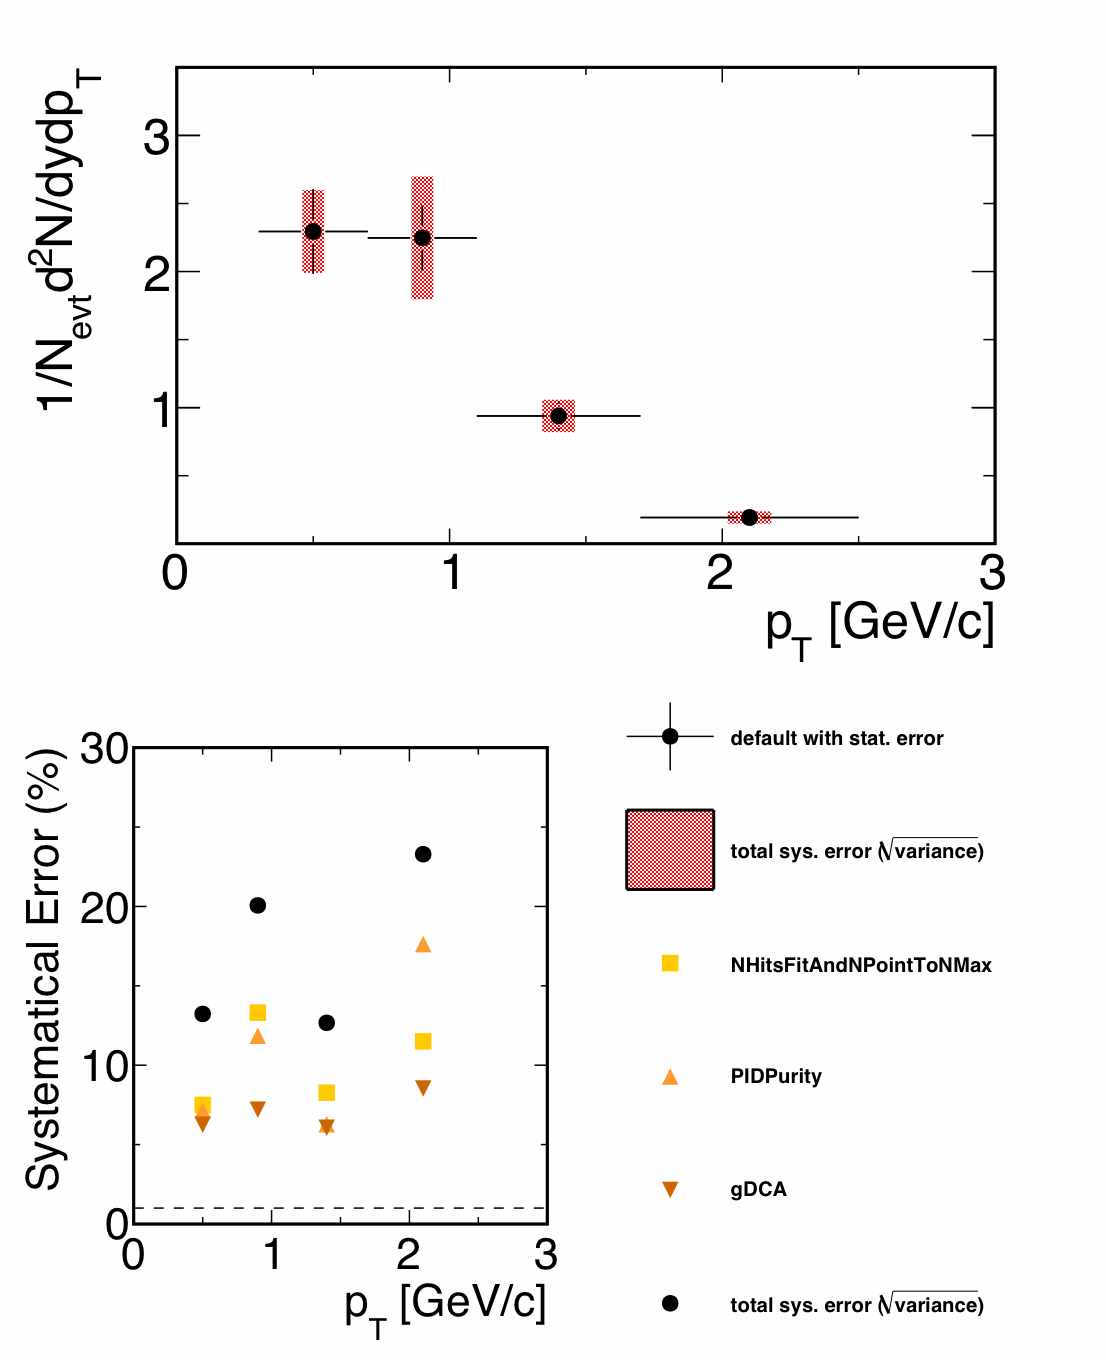
.gif)
The systematic errors are calculated from fit variation
The error bar on right hand side plot is total errors, I mean, sqrt(stat.^2+sys.^2).
First, I did systematic error coming from fit conditions, fit range, normalization range, and fit function.
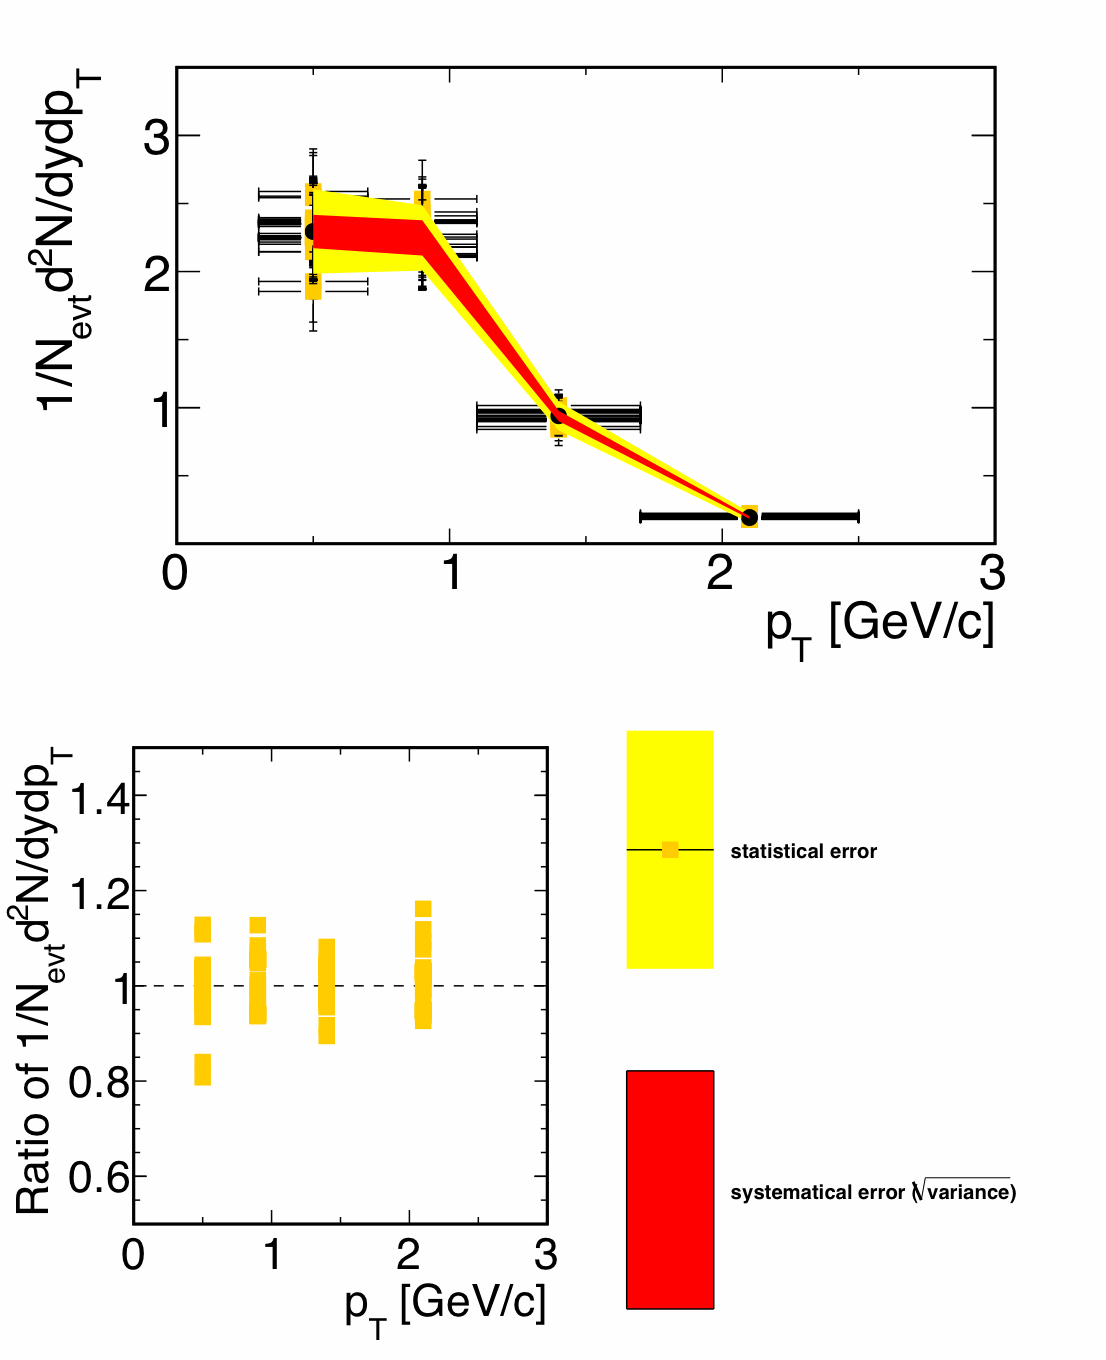
Then apply same fit variation to all cut variation and take mean.
For gDCA,
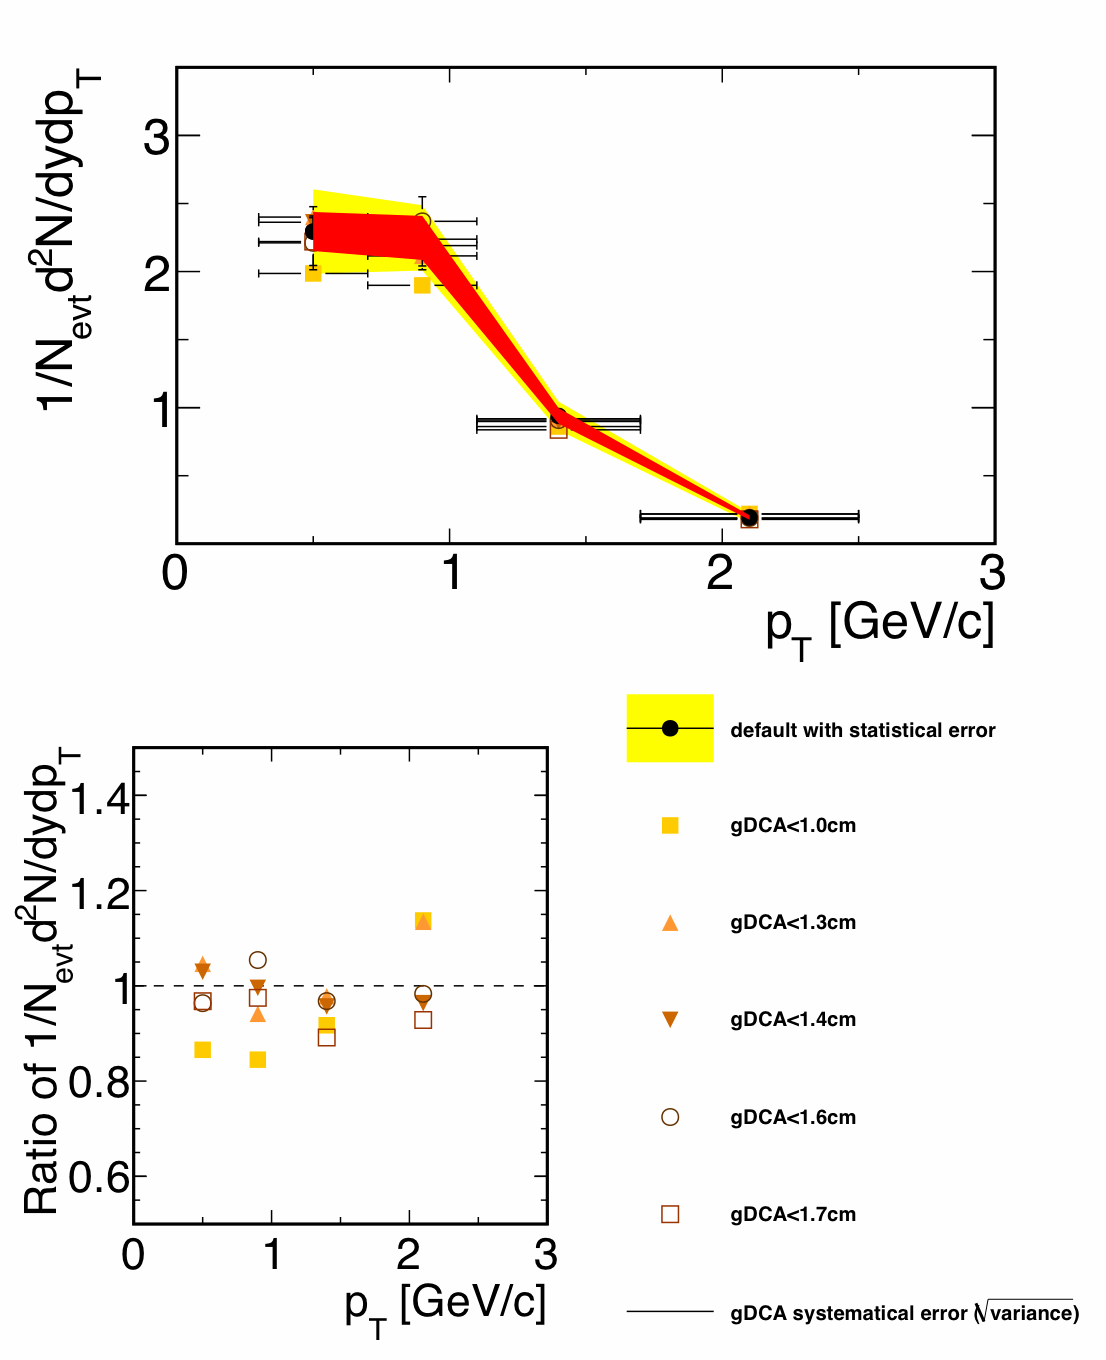
each point represents an average of fit variations that I mention above.
For the gDCA systematic error, I take standard deviations of those points from the default value, sys. error^2 = <(x - default)^2>.
Here is the same plot but for NHitsFit and NHitsPoint/NPossPoints.
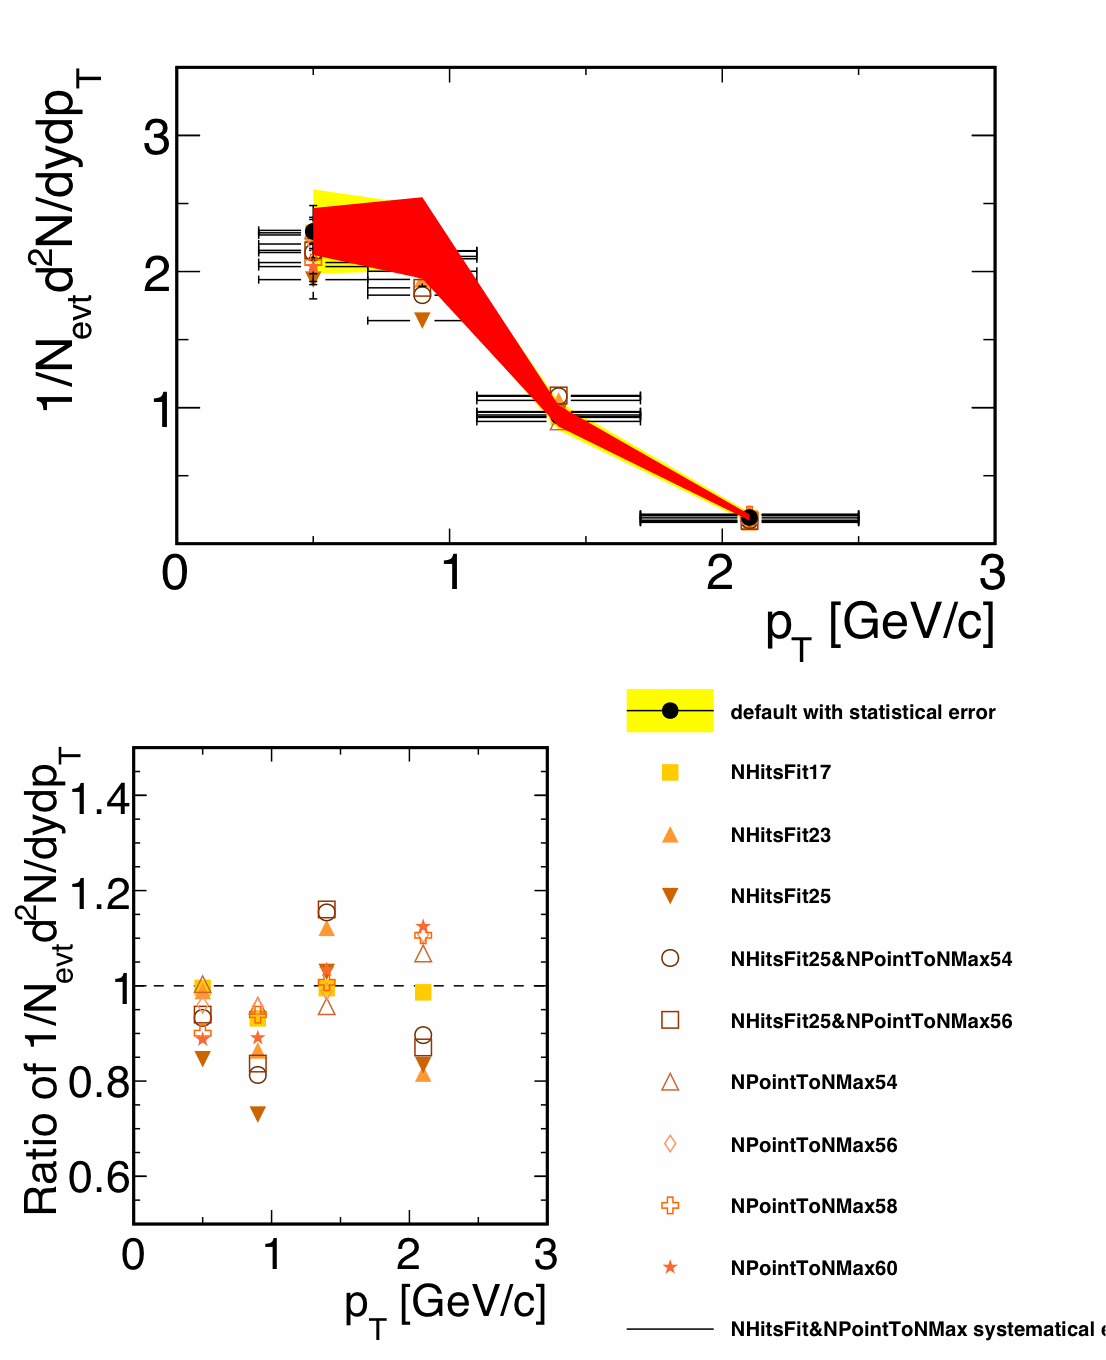
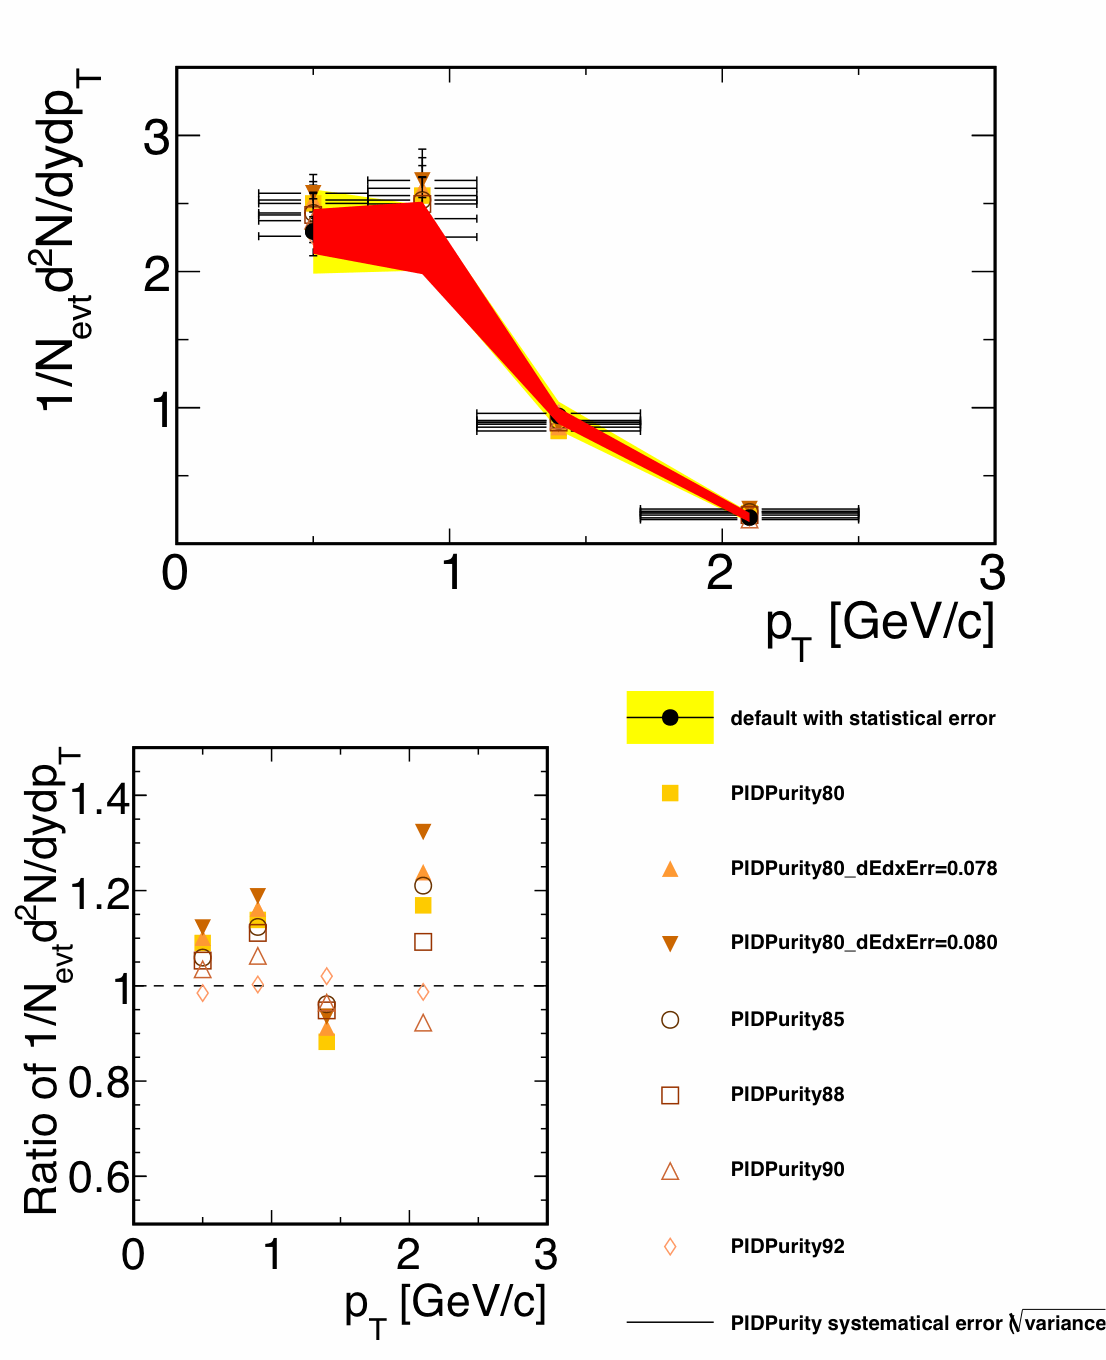
Here is the same plot for PID purity variations.
Groups:
- masayuki's blog
- Login or register to post comments
