Calculation of correction factor for calculation of kt
CORRECTION FACTOR
The intrinsic momentum of partons inside partons is wirtten as 'kt', which lead to accoplanerity of the di-jet events. i.e, one of the jets is out of the plane defined by the second jet(say triggered jet) and the beam axis. kt can also may be measured from the correlation of the associated particles with respect to the leading particles. From correlations we could not get kt but with a multiplicative 'factor'. The input of fragmentation function is requird for calculating the factor. We are using PYTHIA for the inputs.
Here some sybols are defined which are used later : ~
pTt = tranverse momentum of trigger particle
pTa = tranverse momentum of accociated particles
pTt(^) = tranverse momentum of the parton from which trigger particle originate
pTa(^) = tranverse momentum of parton from which associate particle originate
Zt = pTt/pTt(^)
xh(^) = <pTa(^)>/<pTt(^)>
factor = xh(^)/Zt
Events Used :
Pythia jet-jet events.
pt hard is > 2Gev/C
For parton p4 andp5 undegiong hard sacttering to p6 and p7 (p4p5->p6p7)
Histogram names that are used in the plots are defined
1. pt = all final state particle distribution
2. ptmax = leading particle districution
3. pt67 = pt distribution of partons after undergoing hard scattering
4. eta = eta distribution of all final state particles
5. etamax = eta distribition of leading state particles.
1. hkin = > distribution of pT,max(4/5)sin(phi4-phi5) [coplaneriiy between incoming partons]
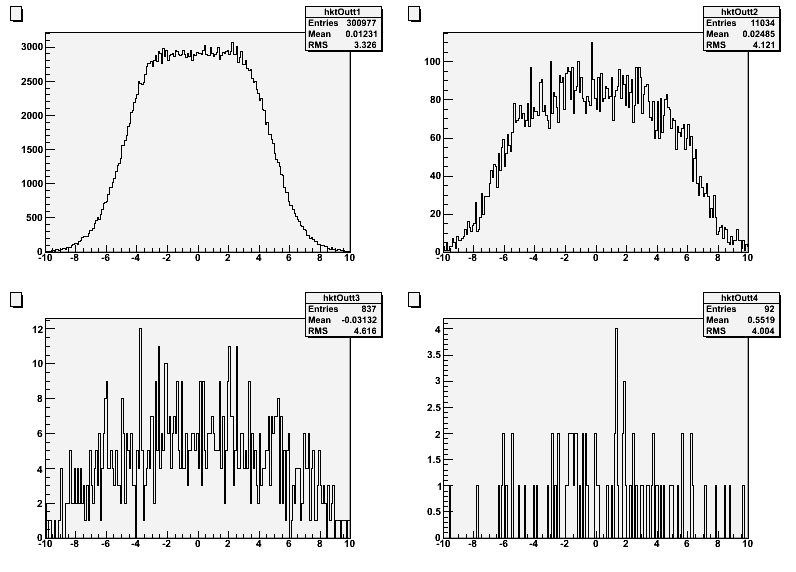
2. hout = > distribution of pT,max(6/7)sin(phi6-phi7) [coplaneriiy between outgoing partons after undergiong hard scattering]
3. DphiOf45 => phi(4)-phi(5)
4. DphiOf45 => phi(6)-phi(7)
5. DeOf45 => ET,4-ET,5
6. DeOf67 => ET,6-ET,7
.gif)
fig(1)
.gif) fig(2)
fig(2)
.gif)
fig.3

fig.4
.gif)
fig(5)
| pTt | <2.0-4.0> | 4.0-6.0 | 6.5-8.5 | 8.5-18.5 |
| kt in(4,5) | 2.46 | 2.92 | 3.2 | |
| kt out(7,8) | 3.32 | 4.12 | 4.6 | |
| kt with multiplicativefactor | 1.6 | 2.4 | 3.0 | |
| correction factor | 1.2 | 0.8 | 0.6 | |
| kt | 1.92 | 1.92 | 1.8 |
kt in(4,5) and kt out(7,8) seems to be quite quite widely different from the value what we have got from correlations.
The same study is made in high pt trigger regions compared to the pi0-ch correclations and find how the result varires.
- mriganka's blog
- Login or register to post comments
