calculation of correction factor to kt with STAR simulated datasets for dijets.
Di-jet cross section from the page :
www.star.bnl.gov/protected/spin/staszak/2006/Sims/Simulation.html
| 3-4 | 690k | 1.297 |
| 4-5 | 686k | 3.151 E-01 |
| 5-7 | 398k | 1.364 E-01 |
| 7-9 | 420k | 2.299 E-02 |
| 9-11 | 412k | 5.504 E-03 |
| 11-15 | 420k | 2.220 E-03 |
| 15-25 | 397k | 3.895 E-04 |
| 25-35 | 400k | 1.021 E-05 |
| 35-45 | 120k | 5.016 E-07 |
| 45-55 | 118k | 2.864 E-08 |
| 55-65 | 120k | 1.447 E-09 |
Simulation dataset page :
drupal.star.bnl.gov/STAR/comp/simu/datasets/2007
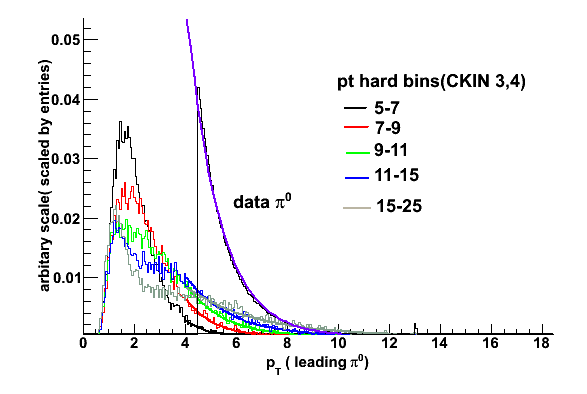
We have used the 5-7, 7-9, 9-11, 11-15,15-25 Pt range expecting the neutral pi0 (for HT data -run 6 for pp) will come pedominantly
from the region.
The data and simulation plots scales by entries are shown below.
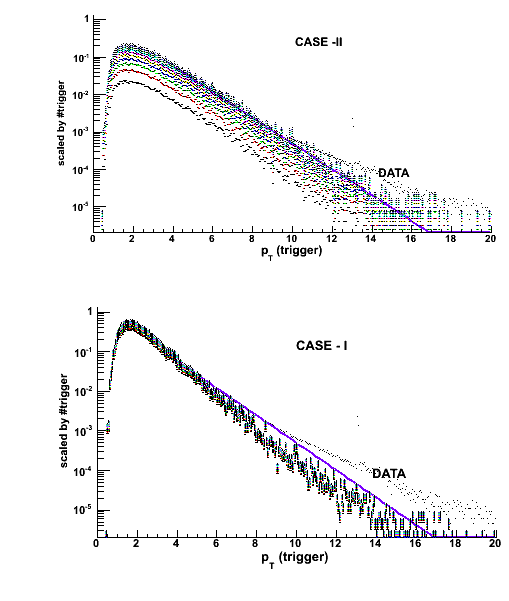
Two cases : (1) sarting from 5-7 bins to 15-25 bins : (CASE-I)
(2) sarting from 5-7 bins to 15-25 bins : (CASE-II)
Double_t sum, frac1, frac2, frac3, frac4, frac5, x1, x2, x3, x4, x5;
x1 = 0.1364;
x2 = 0.02299;
x3 = 0.005504;
x4 = 0.002220;
x5 = 0.0003895;
CASE -I
sum = (x2+x3+x4+x5);
frac2 = x2/sum;
frac3 = x3/sum;
frac4 = x4/sum;
frac5 = x5/sum;
hPREADC[10]->Add(hPREADC[1],frac2);
hPREADC[10]->Add(hPREADC[2],frac3);
hPREADC[10]->Add(hPREADC[3],frac4);
hPREADC[10]->Add(hPREADC[4],frac5);
CASE-I
sum = (x1+x2+x3+x4+x5);
frac1 = x1/sum;
frac2 = x2/sum;
frac3 = x3/sum;
frac4 = x4/sum;
frac5 = x5/sum;
hPREADC[11]->Add(hPREADC[0],frac1);
hPREADC[11]->Add(hPREADC[1],frac2);
hPREADC[11]->Add(hPREADC[2],frac3);
hPREADC[11]->Add(hPREADC[3],frac4);
hPREADC[11]->Add(hPREADC[4],frac5);
.gif)
Multiplying hPREADC[10] and hPREADC[11] with 1.0, 2.0, ..... 10.0 in order to match the data, CASE-II seems to be reasonable.
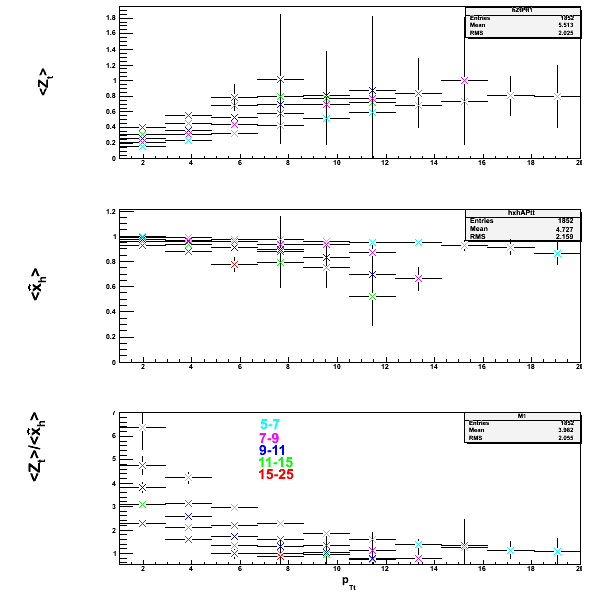
NOW the steps here used to extract the correction factor is that the correction factor for 7-9, 9-11, 11-15, 15-25 pT bins extracted.
and finnally it is avearged out for all the pT bins with relative weightage.
WITH PTt (trigger particle)
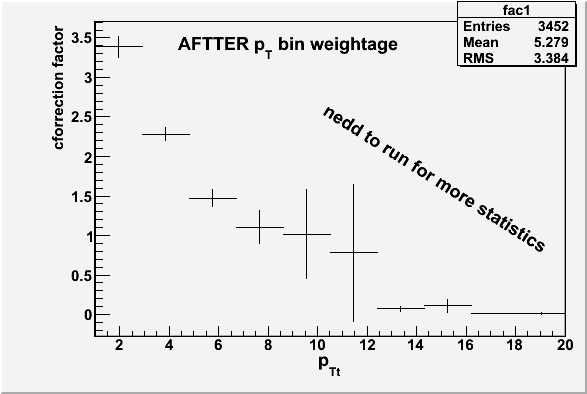
After proper weightage :
WITH pTa(associated particles) [pTt = 6.5 - 8.5]
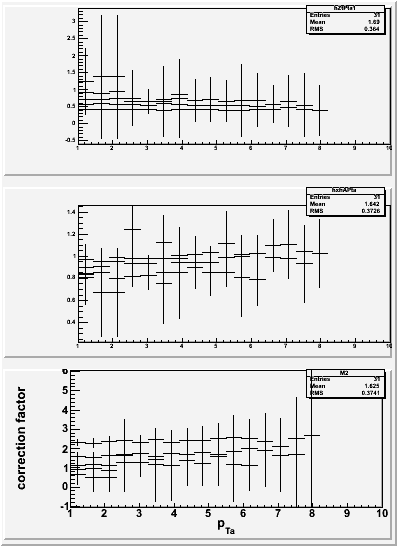
This is done for 1/5 th if the simulated dataset in grid. Runing for full dataset.
We have used ch-ch correation function using charge tracks for trigger particle and the pT range is relatively
lower compared to that from neutral pion from BEMC.
Simulated data for MB and CKIN 3-4, 4-5, 5-7, 7-9 in comparison with real data is shown here.
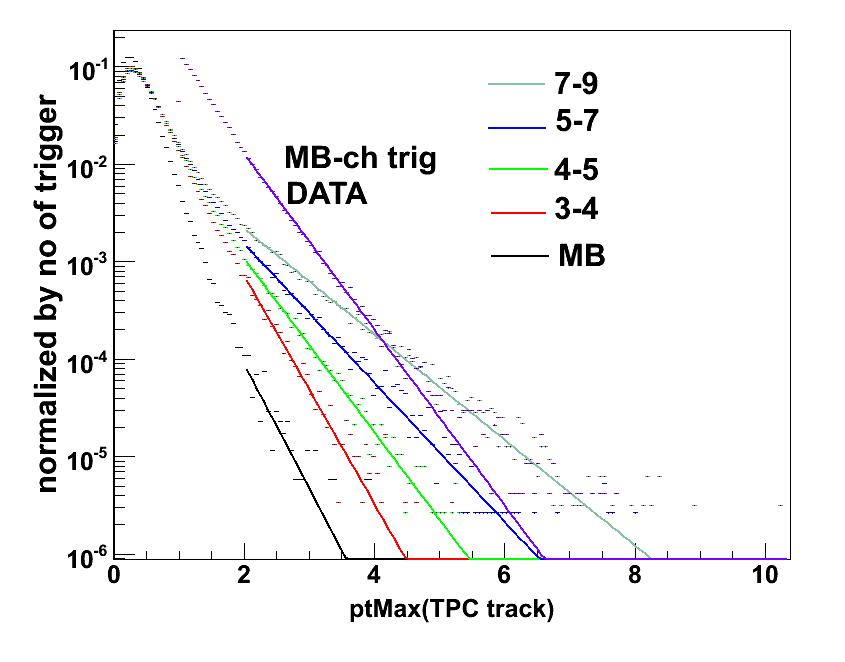
Using CKIN with relative weightage
3-4 x2 = 1.297;
4-5 x3 = 0.3151;
5-7 x4 = 0.1364;
7-9 x5 = 0.02299;
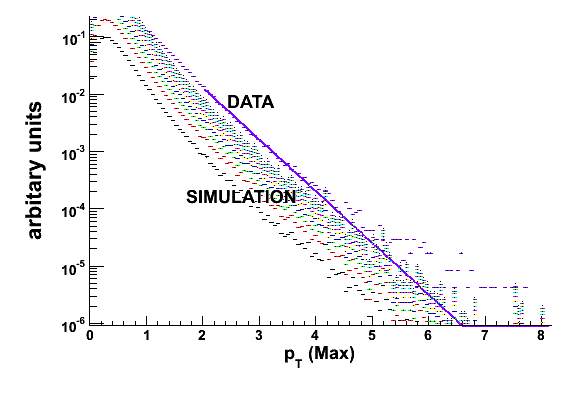
we have the comparison of data and the simulated data.
Here we are interested for pT > 4.GeV
- mriganka's blog
- Login or register to post comments
