Correction factor in the continum limit :
Earlier way of calculating and problem for wide pT hard bins :
This is the page where the star simulated data has been used for calulating <Zt> <\hat(xh)>-1 . The simulatd
datasets contain pt-hard bins in the ranges : 3-4, 4-5, 5-7, 7-9, 9-11, 11-15, 15-25, 25-35 GeV/c. It has been shown
earlier that mixing the bins (7-9, 9-11, 11-15, 15-25, 25-35) are sufficient for reproducing triggered neutral cluster
pt distributions which correspons to HT2 data.
The correction factor (" f ") for all the bins are summed up by making correspondig cross section weightage as follows :
| pt hard bins | x-sections | <Zt><\hat(xh)>-1 |
| pT,hard 1 | x1 | f1 |
| pT,hard 2 |
x2 |
f2 |
f = (f1 *x1 + f2 *x2 + f3*x3 + ....... ) / (x1 + x2 + x3 + ....)
It is obvious that the f1 distibution can not extend above the maximum value of pT,hard 1.
Therefore while making weighatage we found a jump in the value of " f " for using the pT
bins of a wide ranges while going to high pT ranges.
The method describes here for transfrom this discontinutiy to a continious limit.
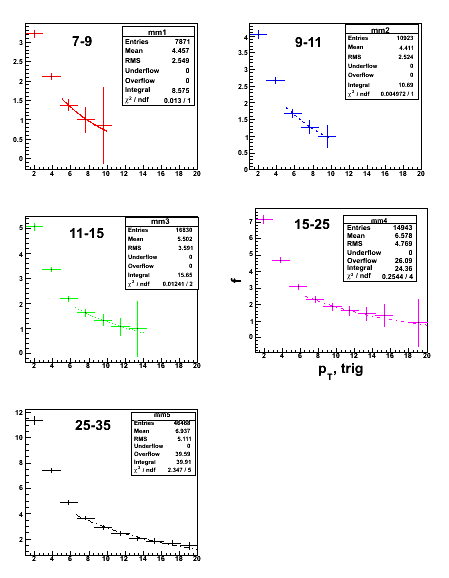
1. " f " distributions for different pT hard bins are fitted with exponetial distributions.
2. The parameters, the constant (par[0]) and the slope (par[1]) changes for different pT-had bins.
3. The par[0] and par[1] as a function of <pT (hard scattered partons)> has been extracted. The function
used here is polinomial of degree 2.
4, x-section as a function of <pT (hard scattered partons)> has also been fitted with expo[0]+expo[2]+expo[3]
and seems to be rasonable in the <pT, trigger> for for pT, trigger bins we are looking for.
5. Hence f = (f1 *x1 + f2 *x2 + f3*x3 + ....... ) / (x1 + x2 + x3 + ....) has been calculated for fine pT-hard bins.
FIG : 1 : <Zt>, <\hat(xh)>-1 and "f" for various pT hard bins :

FIG. 2 : expo fitting (region of interest in x-axis 6-20)

FIG. 2 : x section as <pT (hard scattered partons)>

FIG. 4 : par[0] and par[1] as a function of <pT (hard scattered partons)>

FIG : 5 the final value if " f " is shown in thick dotted black line.
.gif)
- mriganka's blog
- Login or register to post comments
