gSTAR simulation for single particles in FMS
Single particles with neutral pions and photons with energy 40GeV, 80GeV, 120GeV are 160GeV are thrown within pseudorapidity 2.6-3.5.
This is mostly large tower region in FMS. Comparisons of energy for jets made of photons(RED), clusters(GREEN), and towers(BLUE) shown in the figures. For eta and phi distributions, a solid black line indicates distributions for the incident γ/π0's in the detector.
energy distributions γ/π0
Energy = 40GeV Energy = 80GeV Energy = 120GeV Energy = 160GeV
.gif)
pseudorapidity distributions γ/π0
.gif)
phi distributions γ/π0

pT distributions γ/π0 (towers)
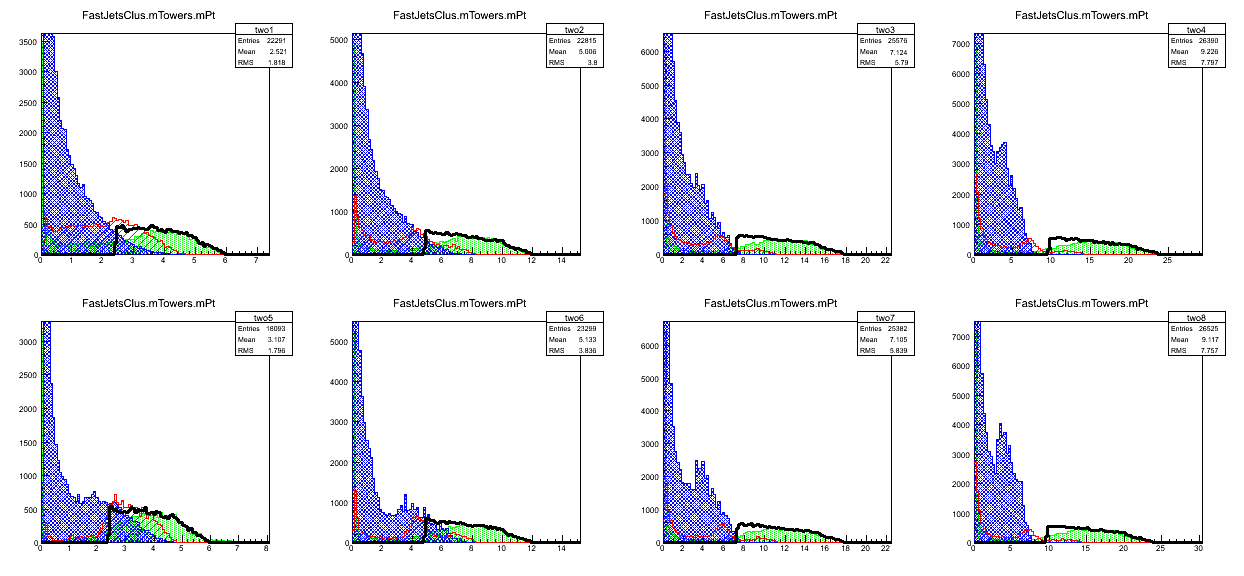
eta distributions γ/π0 (towers)
.gif)
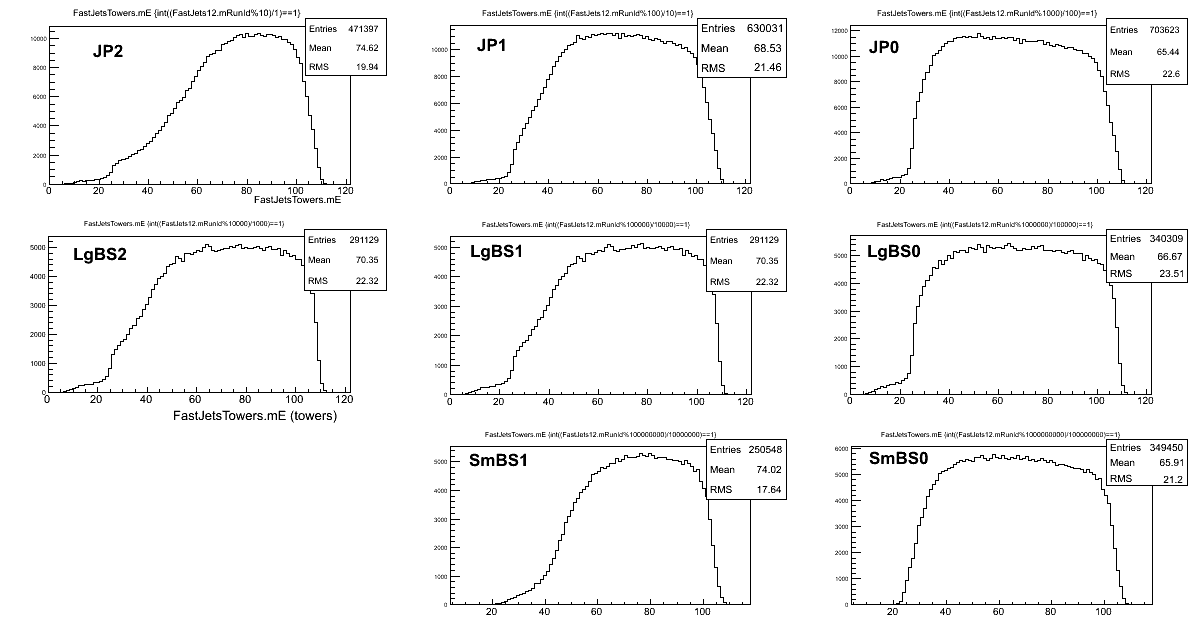
energy distributions γ/π0 (towers)

Single particle π0's in 30-120GeV within pseudorapidity 2.5-4.2
energy, pt, eta and phi comparisons for thrown particles(black solid line), towers(blue), clusters(green) and photons(red).

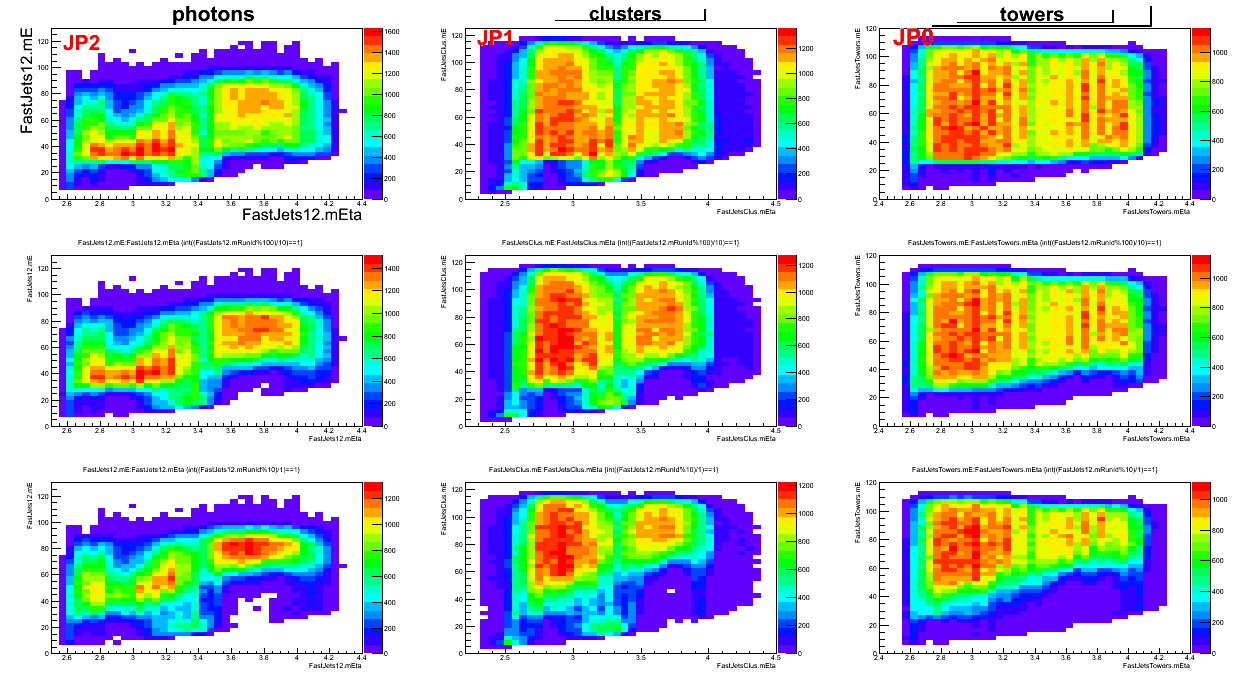
pseudorapidity vs. energy for JP0, JP1, JP2 triggers for photons, clusters and towers.
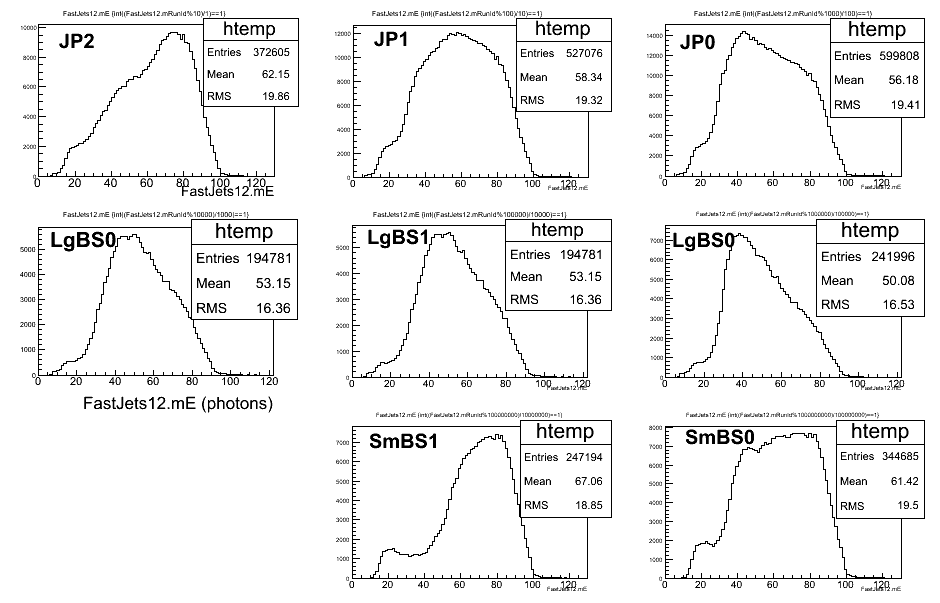
energy distributions of photons for various triggers:
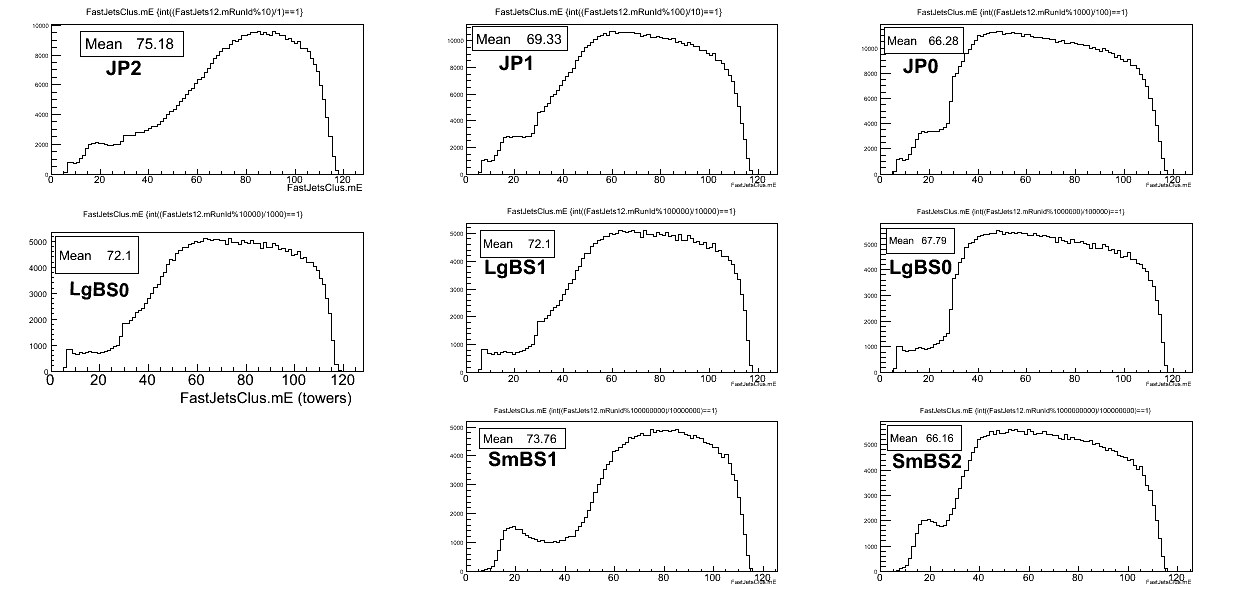
for clusters :
for photons :
- mriganka's blog
- Login or register to post comments
