Initial fit function parameter check
2-4 PT bin: (range 0.03-0.8)
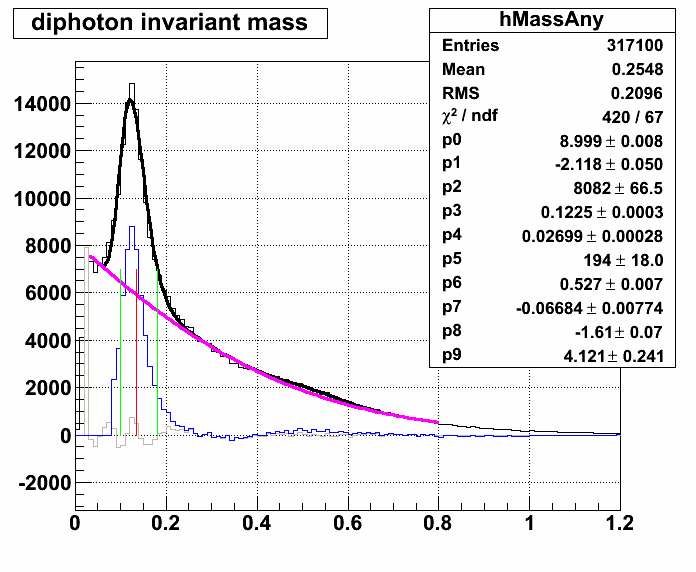
4-6 PT bin: (range: 0.03-0.8)
.gif)
6-8 PT bin: (range: 0.03-0.8)
.gif)
8-10 PT: (range change here to get best possible fit: 0.05-0.8)
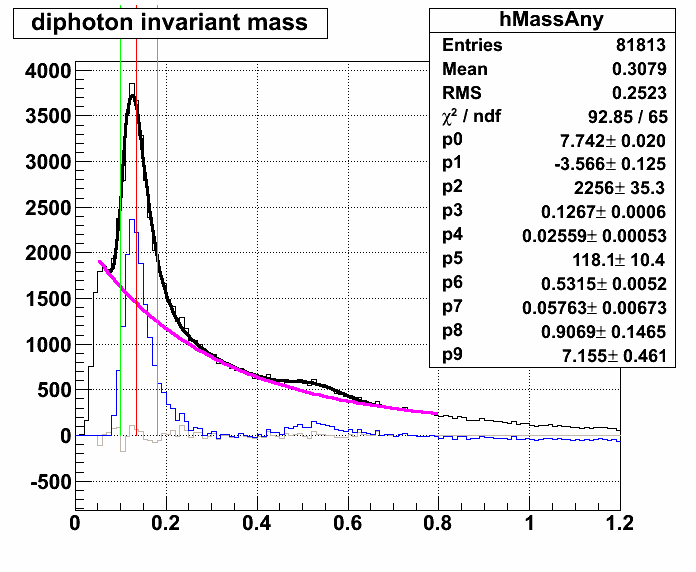
Last PT bin here: 10-30, but the counts were too low to get a very good fit. I saved two different histograms, one with a shorter range (0.05-0.6) that fitted a good background function, but failed to detect an eta peak. The other had a longer range (0.05-0.8) that fit somewhat of an eta peak given the low amount of counts, but the background function was haywire. The first is the shorter range, the second is the longer.
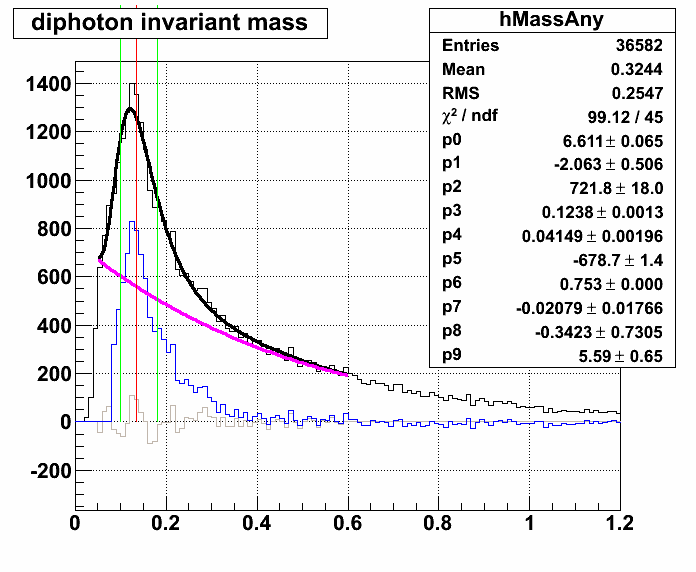
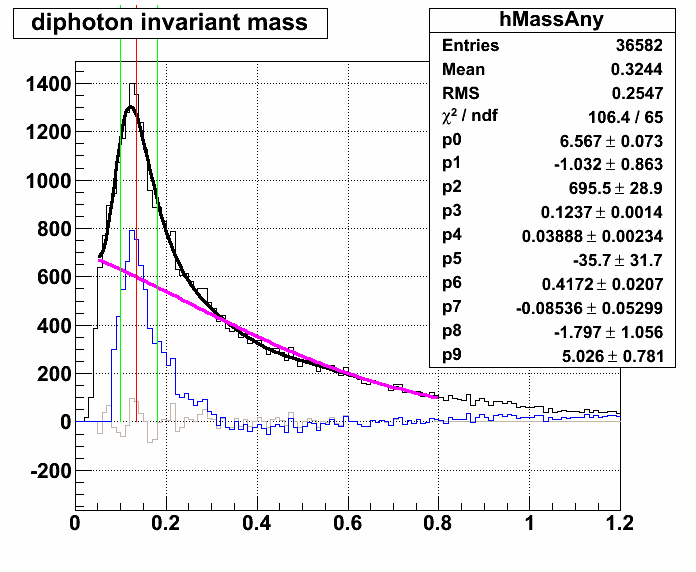
The next histogram presents the peak asymmetry parameter (p9) as a function of the PT bins. the value of p9 for the 10-30 PT bin was taken from the shorter range histogram since the fit function did not overshoot the signal.
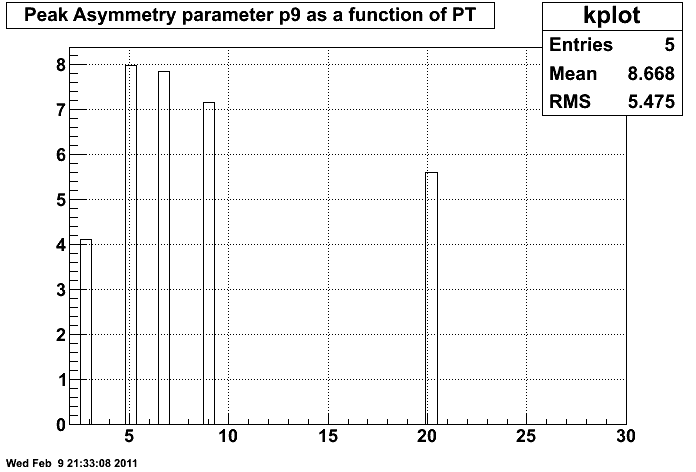
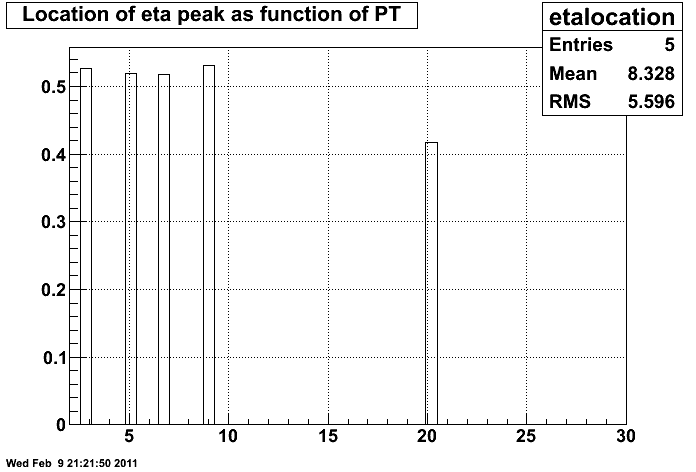
The last histogram presents the eta peak location as a function of the PT. The point from the 10-30 PT bin was taken from the longer ranged histogram since it detected a peak in that fit.
- ncolmena's blog
- Login or register to post comments
