Alternative PT bin fits
This study was done with the fit function given by: 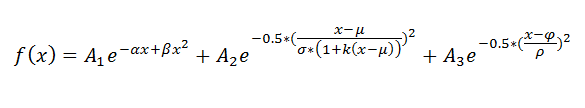
This includes a background exponential term with an added curvature component given by beta (p8), a skewed gaussian term including the peak asymmetry parameter k (p9) to fit the pion peak, and a gaussian term to fit the eta meson peak. A1, A2 and A3 denotes the amplitude of the background shape, pion peak and eta peak respectively. -alpha denotes the slope of the background. Mew denotes the pion peak position, sigma the width of the pion peak, phi the eta peak position, and rho the pion peak width. The purpose of this study is to determine the stability of the fit function given the added terms.
A study of the peak asymmetry parameter was done with 2006 data by Weihong He with an older version of a fit function. This function did not contain an eta component or a curvature component in the background exponential. Page 115-116 describe his optimization of the fit function and the ppeak asymmetry parameter.
β
STAR/files/userfiles/2992/Weihong Thesis.pdf
This first histogram contains data from the 2-4 PT bin. The range is 0.03-0.8
.gif)
This histogram contains data from the 4-5 PT bin. The range is 0.03-0.8
.gif)
This histogram contains data from the 5-6 PT bin. The range is 0.03-0.8
.gif)
This histogram contains data from the 6-7 PT bin. The range is 0.03-0.8
.gif)
This histogram contains data from the 7-9 PT bin. The range is .035-0.8
.gif)
This histogram contains data from the 9-30 PT bin. The range is 0.05-0.9
.gif)
- ncolmena's blog
- Login or register to post comments