Variable parameter fit study as function of PT bin
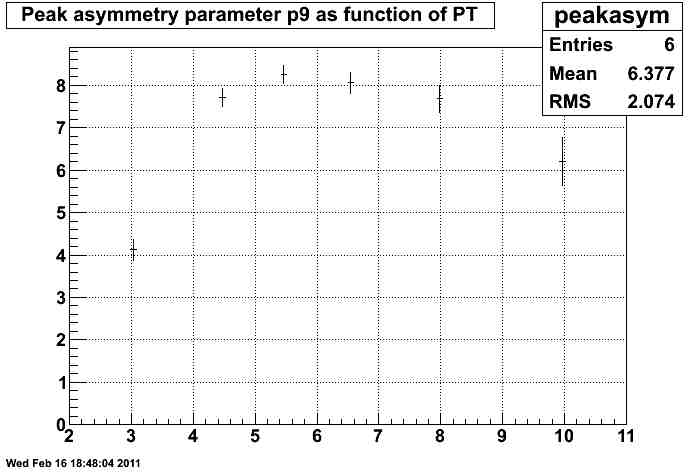
This first histogram is a study of the peak asymmetry parameter (p9) as a function of PT:
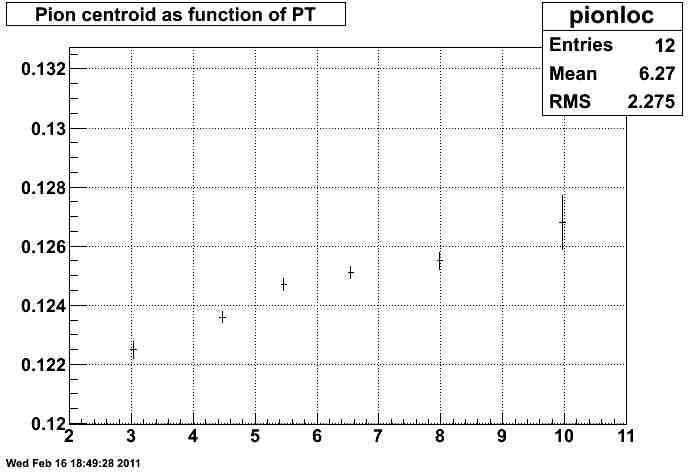
This histogram is the pion peak centroid as a function of PT bin:
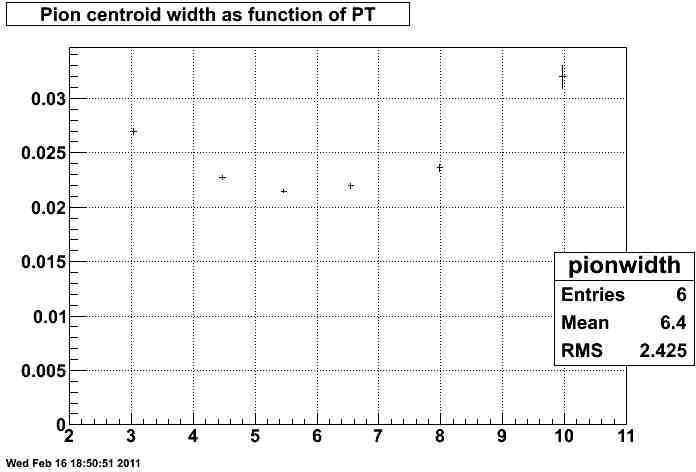
This histogram is the pion peak centroid width as a function of PT bin:
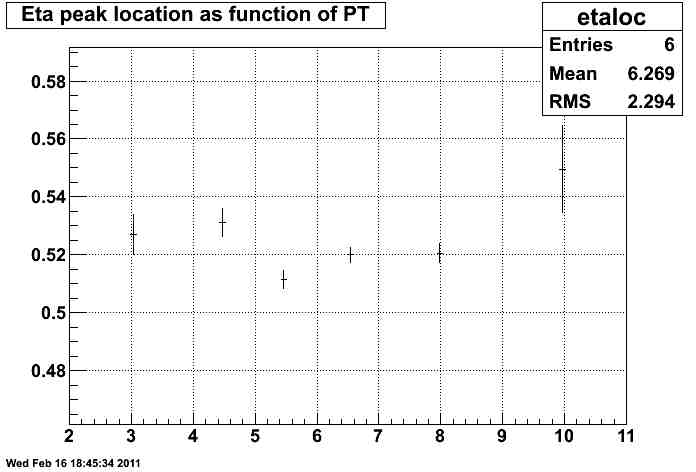
This histogram is the eta peak centroid as a function of PT bin:
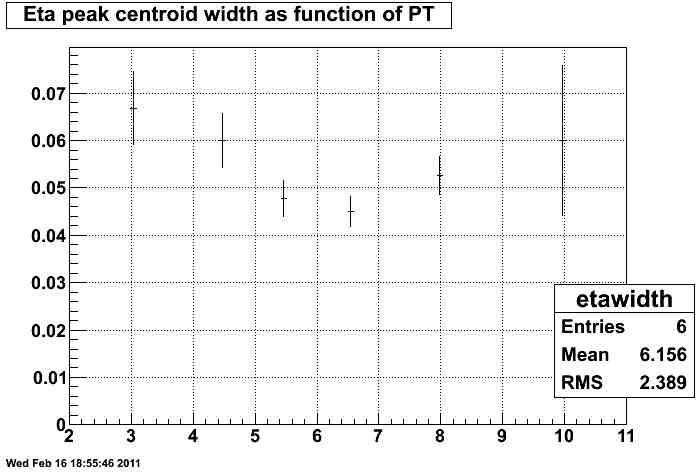
This histogram is the eta peak centroid width as a function of PT:
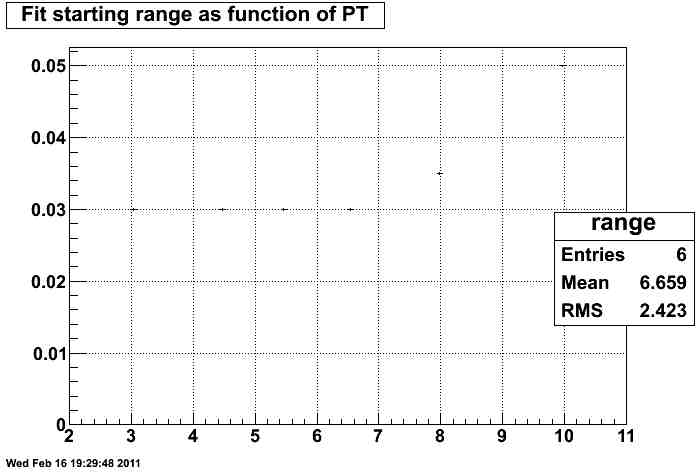
This histogram is the starting fit range as a function of PT bin:
Histogram of the exponential background constant term as a function of PT:
Histogram of the exponential background linear term as a function of PT:
Histogram of the exponential background quadratic term as a function of PT:
Histogram of the pion centroid amplitude as a function of PT:
Histogram of the eta centroid amplitude as a function of PT:
- ncolmena's blog
- Login or register to post comments