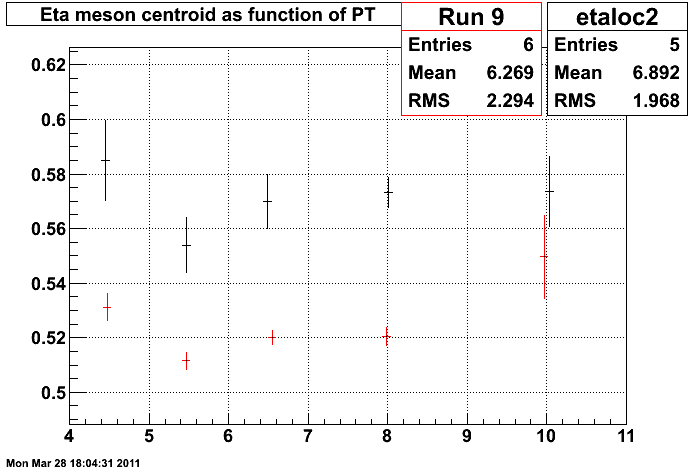
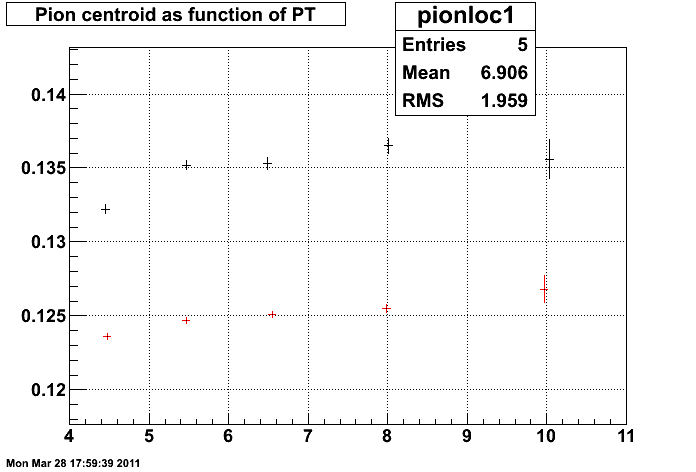
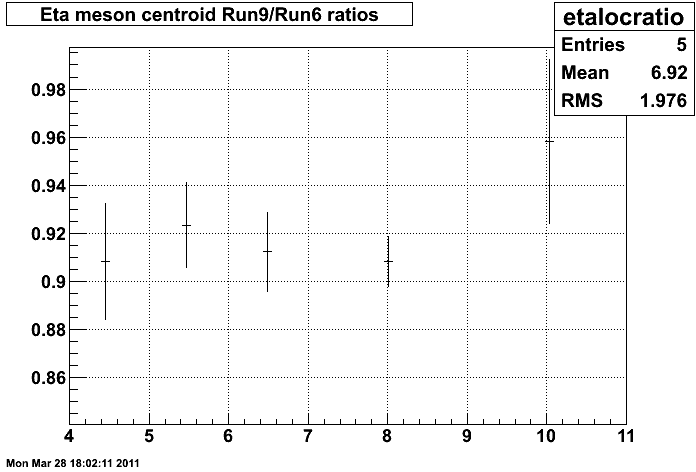
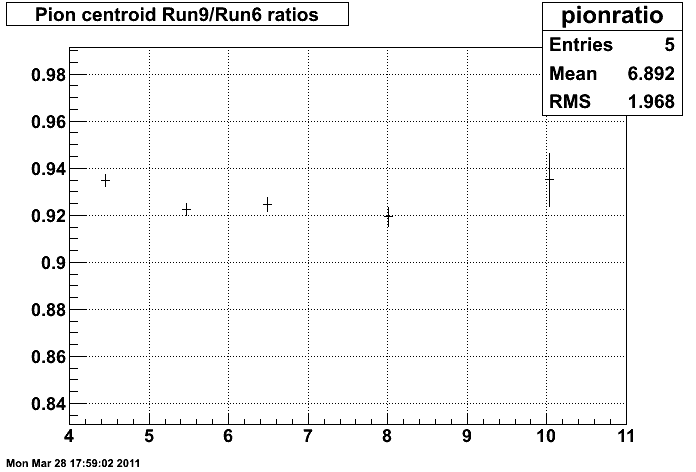
Differences in eta/pion centroids in run 6 and 9
For the first two plots, the points in red represent Run 9 data, black is run 6.


Groups:
- ncolmena's blog
- Login or register to post comments
 The STAR experiment |
|
User loginNavigation |
Differences in eta/pion centroids in run 6 and 9For the first two plots, the points in red represent Run 9 data, black is run 6.
Groups:
|