Initial comparison of Run11 pi0 centroids
The following is an initial look at the run 11 pi0 centroid using the St_Physics data stream (rather than the W stream used in earlier blog posts). The run list is provided here:
STAR/files/userfiles/2992/Run11runlist.txt
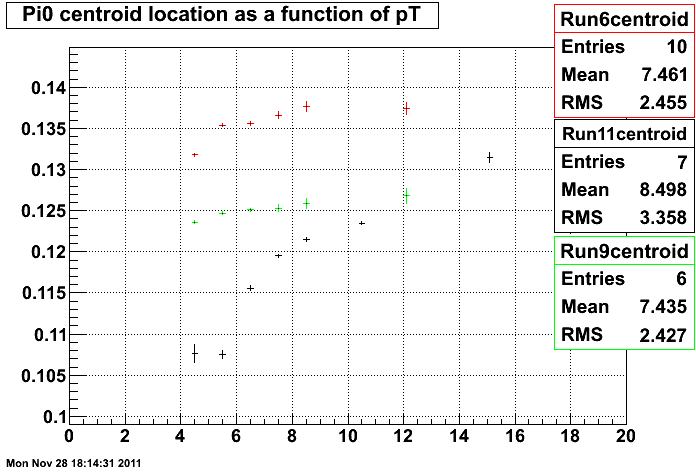
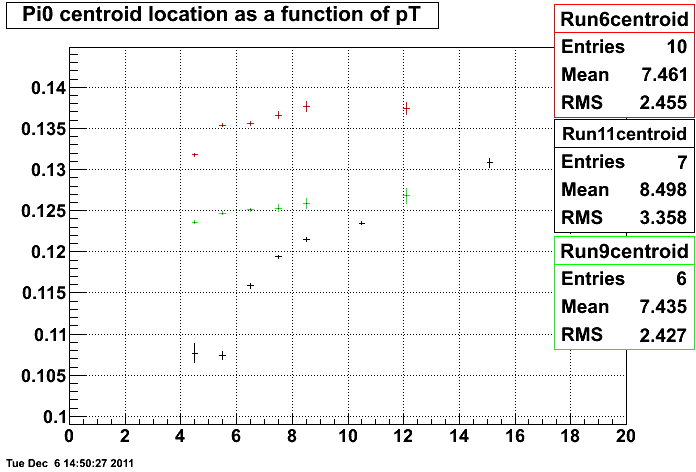
The first histogram below is a comparison of the Run6 (red)/Run9 (green)/Run11 (black) centroids. The plots following that are the fitted invariant mass plots for the various pT bins of Run 11.
Note that the last points of the Run 6 and Run 9 sets are for the pT range of 9-100 and the last point of the Run 11 set is for 12-100 pT (the second to last for Run 11 is 9-12) and are plotted at their respective x-axis values for convenience.
4-5 pT:
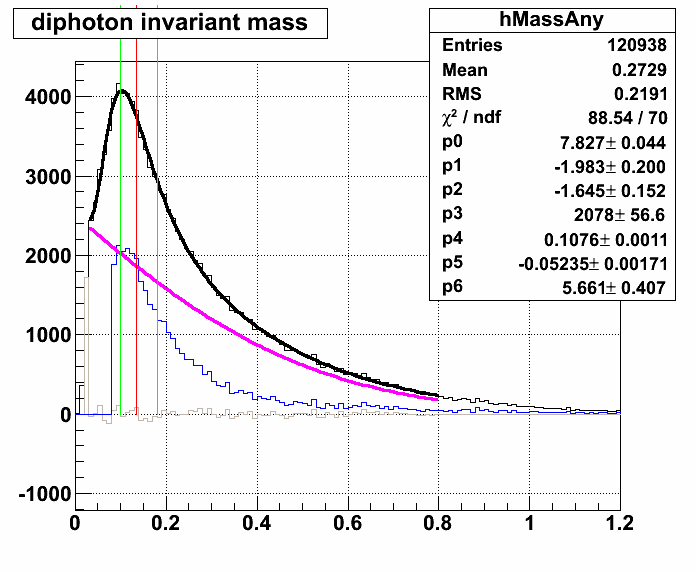
5-6 pT:
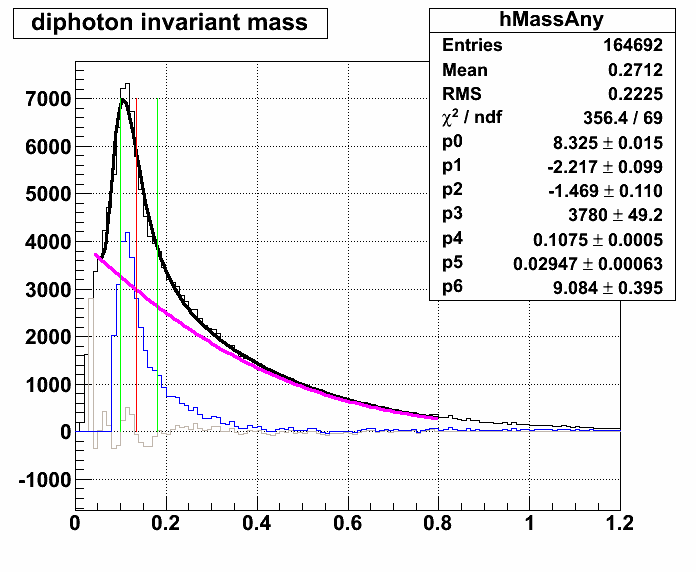
6-7 pT:
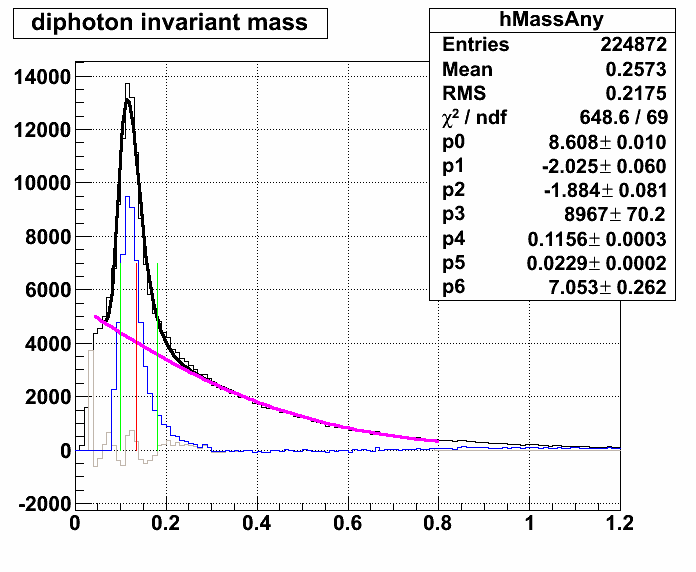
7-8 pT:
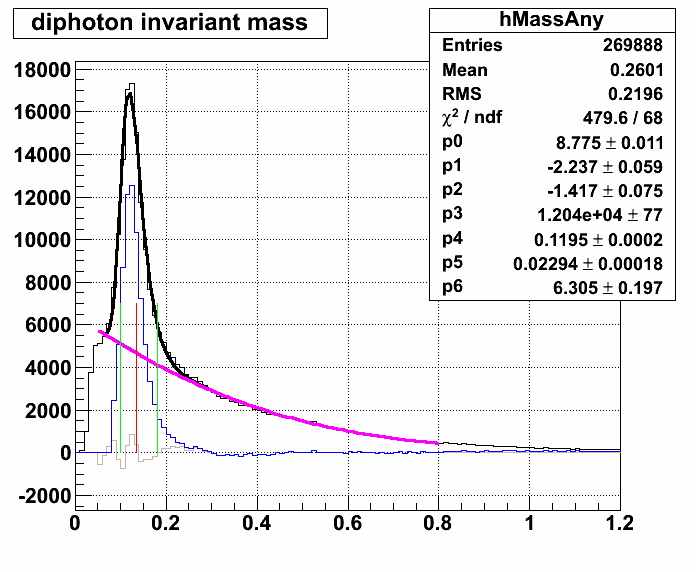
8-9 pT:
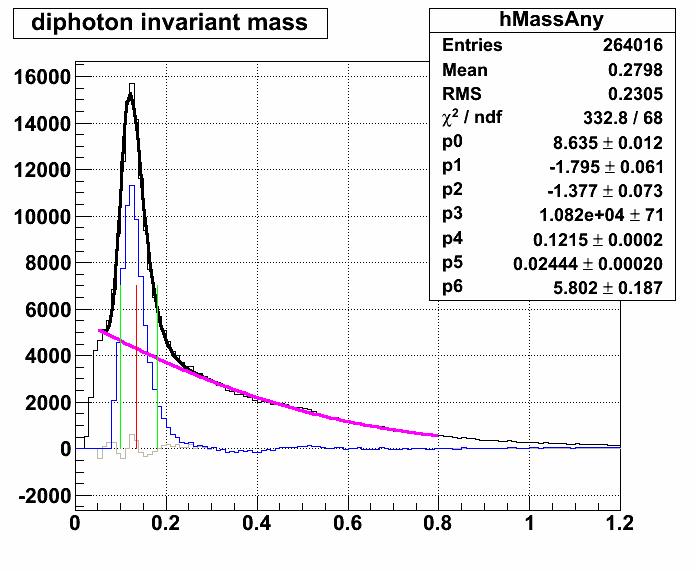
9-12 pT:
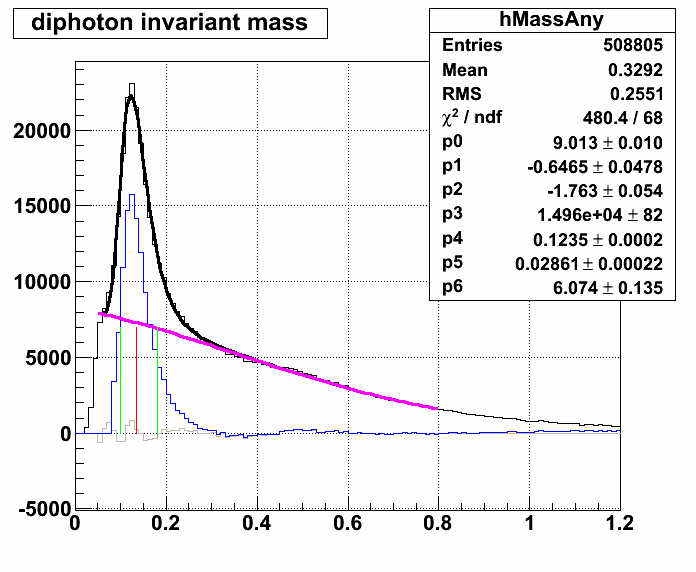
12-100 pT:
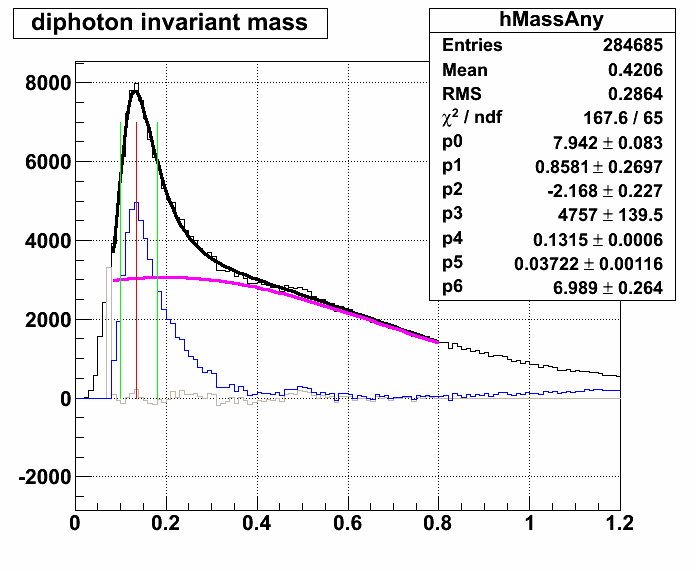
Because of the strange trend in the mass plot, a quick QA will be done on the runs that were selected. The results are shown below, essentially nothing changed.
****Note: Using Anselm's QA list, 28 runs were thrown out from the original list that is provided in the link near the beginning of this blog page. The runs that were thrown out are:
12099029, 12099030, 12099031, 12099041, 12100005, 12103016, 12103019, 12103023, 12103024, 12105005, 12105009,
12105010, 12106023 12106024, 12106025, 12106026, 12106027, 12106033, 12106041,
12106049, 12106067, 12106069, 12106073, 12107002, 12107008, 12107014, 12107027, 12107030
12107040
Here is the new centroid comparison plot (it's essentially the same, so there must be some other cause for the strange trend in the Run 11 pion centroid):
- ncolmena's blog
- Login or register to post comments
