Progress towards run 6 pion cross section
This is provided as a quick look at some preliminary results concerning the run 6 pion cross section. The luminosity measurement was mainly done using Jamie's list of luminosities per trigger per run: http://www.star.bnl.gov/protected/common/common2006/trigger2006/plots/
I.e. on that page, "eemc-http-mb-L2gamma_137641_byrun.txt" and "eemc-http-mb-L2gamma_6_byrun.txt"
were used.
The runs I used are listed here: STAR/files/userfiles/2992/runlistforxSection.txt
The process I went through to extract a number for the luminosity is as follows: Using the byrun text files, I copied those numbers over into the third sheet of my excel file (provided below). The numbers, by column (from Jamie's file- on my excel, there are more columns, etc.), are the run number (column 1), the time ID (column 2), the number of L2 events divided by the number of min bias events times their pre-scale factor (column 3), the error on the previous column (column 4), and the pre-scale factor of the L2 events (column 5). For each run in my list, I used the number of L2 events as counted by the code and divided out that factor from column 3 (also dividing out the pre-scale factor using column 5) and taking the inverse in order to get just the number of min bias events times their pre-scale factor. These are added up by run and divided by the min bias cross section taken from Tai Sakuma's study of the inclusive jet cross section here: http://people.physics.tamu.edu/sakuma/star/jets/c101121_event_selection/s0400_luminosity_001/web_luminosity.php
The calculated luminosity for this run set came out to be 5.62 +- 0.432 pb^-1.
The reason that I had to use this exercise rather than simply counting up the number of min bias events is because the histogram that records the number of min bias events for each file was disabled when the code was run.
One will notice that number of L2 events (column F and P in my excel sheet) are slightly more than the number that is recorded in the run log browser for each run. This has not been greatly looked into at this point, but has been taken into account that the highest difference between the number of L2 events counted by the code and in the run log browser is about 2%. This has been recorded as a systematic uncertainty towards the final cross section in order to account for the difference.
The acceptance and efficiency correction factors for various pT bins were calculated using Weihong's "eff.C" macro which just takes entries from a histogram of reconstructed pion pT and divides it by a histogram of genereated pT using the full QCD background pythia sample (i.e. the values shown in the histogram are the products of the pion reconstruction efficiency times the trigger efficiency) . The resulting histograms are shown below. The cuts involved with the generated pions in the simulation are:
thrown between 0 and 3 eta
pT must be greater than 3.0 GeV/c
hHeight must be between hlow and hhigh
where hHeight = pT*(270.0 - z vertex position)/(pZ)*magnitude of x-y plane position vector)
and hlow= 270.0*tan*(15.0*pi/180.0) or 72.346 and hhigh= 270.0*tan(40.0*pi/180.0) or 226.56
.gif)
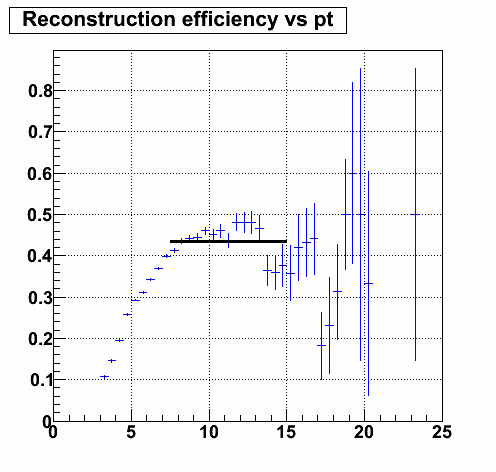
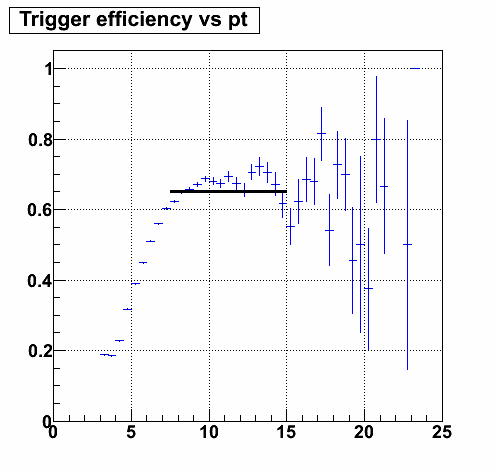
for reference, the reconstruction (# pions reconstructed over # times trigger fired) and trigger efficiency (# times trigger fired over # generated pions) plots are presented below, respectively:


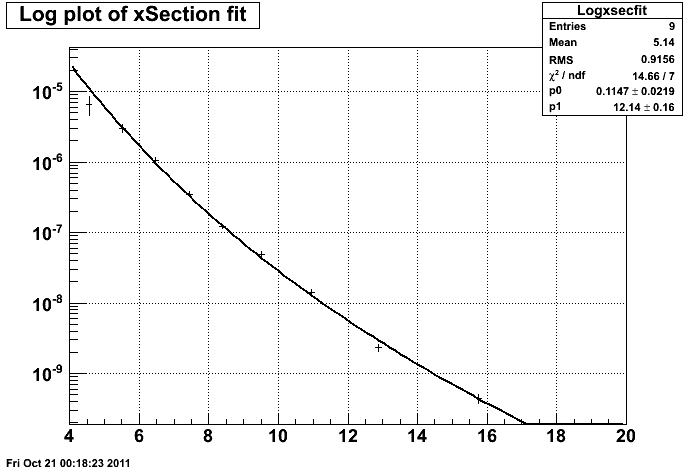
The actual cross section calculation is well-explained in Justin's old blog post here: http://drupal.star.bnl.gov/STAR/system/files/xsec-intro.pdf
A graph of the cross section is presented here with a power-law fit applied to it:

A summary of the major systematic uncertainties (that have been studied so far) is given below.
One systematic error affecting the background subtracted yield was estimated to be around 5% by studying the use of different fit ranges and also using different background fit functions such as a regular (rather than exponential with a curvature term) exponential fit and a power law fit given by:
E (d^3 N)/(dp^3 )= A/(1+p_T∕p_0 )^n
The systematic uncertainty in the calorimeter tower calibration (or the uncertainty in the uncorrected yield Y) was estimated by:
δY(p_T)=|dY(p_T)/dp_T| δp_T
where the uncertainty in p_T was estimated to be 2% based on how closely the fitting procedure finds the pion centroid to be in each p_T bin.
The resulting systematic error averaged to be about 12%.
Also, as explained above, there is a 2% systematic uncertainty due to the difference in counted L2 events versus recorded L2 events in the run log browser.
Note for reference, the raw excel spreadsheet used to gather most of this information is attached. The first sheet titled "Eff study-xSec" contains the efficiency correction factors along with their errors for each bin as well as the progression to calculate the actual cross section. The second, titled "Bin centering" was to study what the actual p_T values should be plotted as based on the raw yield. The third, titled "Lum by run" is a list of the luminosities from Jamie's files as talked about above. The fourth is inconsequential (it is merely a check to make sure the values shown in the efficiency plot above actually does match the product of the reconstructed efficiency and the trigger efficiency). The fifth, "Calorimeter syst. unc. fit study is the study of what I just talked about above and the sixth is the systematic uncertainty study of the background, where I vary the fit range and fit function.
- ncolmena's blog
- Login or register to post comments
