Run 9 / Run 6 ratio of pion centroids as a function of Phi and Eta
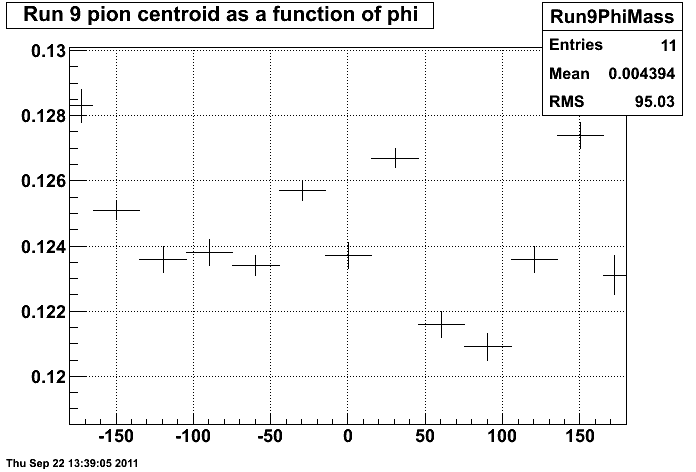
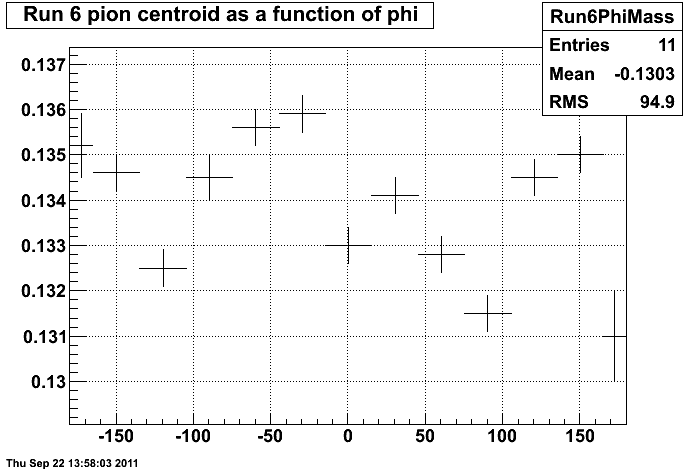
This plot was done so the points more closely correspond with the boundaries of each sector. (I.e. the middle bin is from -15 to +15 in phi). Also, the points at the ends reflect the boundary between crate 5 and 6...the left-most is -180 to -165 and right-most is 165 to 180)
The second and third plots are Run 9 and Run 6 centroids as a function of phi, respectively.
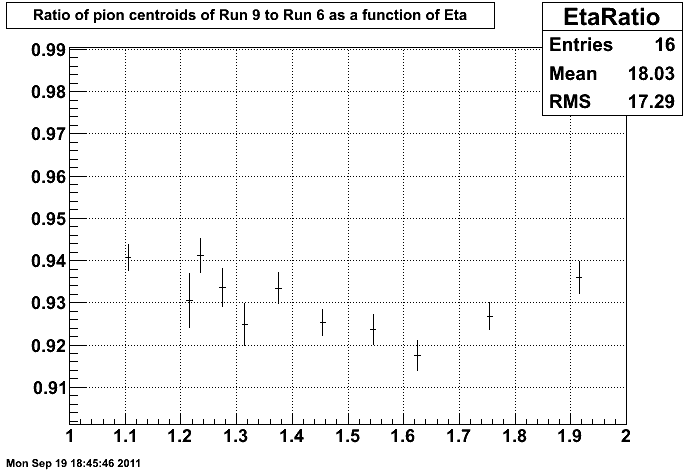
The last plot is the ratio of the Run 9 to Run 6 pion centroids as a function of eta.
.gif)


Groups:
- ncolmena's blog
- Login or register to post comments
