Gamma point mixing in adjacent sectors study
This study is being done in an attempt to gain a better reconstruction efficiency for eta mesons by considering mixing points (i.e. gamma candidates) from adjacent sectors (up until now the code has only considered same sector point mixing). This results on average with a bigger opening angle between the points, thus a bigger mass and (hopefully) a better resolution around the eta meson peak. By using same sector and adjacent sector mixing separately, we would have access to both a nice pion peak (from same sector) and eta peak (from adjacent sector) to use for calibration.
First I ran the code over a small set of runs from (NOTE:) RUN 9 (STAR/files/userfiles/2992/Pointmixinginitruns.txt) to see what the resulting invariant mass plot looks like while only mixing points in adjacent sectors- this means points in the same sector and non-adjacent sectors are thrown out. Here is the mass plot: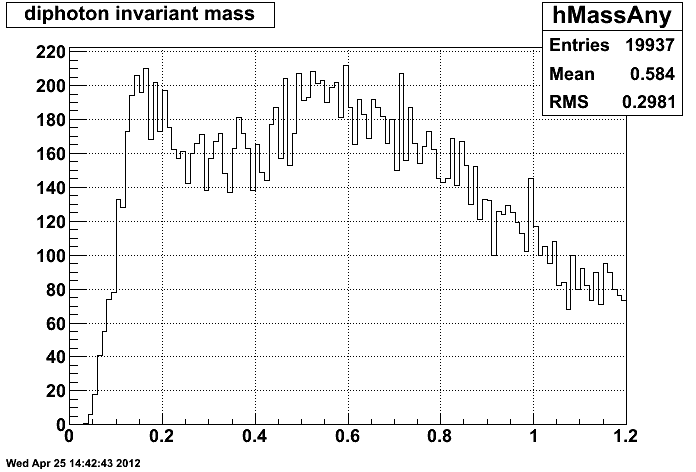
It is seen that the pion peak and eta meson peak (~0.55) are at about the same height so at first glance it seems to have done its job, at least to an extent. The problem with the mass plot now is the rough background which won't result in a well-defined peak around the eta mass.
Here is a plot of pion/eta PT versus mass; it is expected to show the pions die off after low PT and the etas to have a stronger presence at slightly higher PT though this plot shows a more level correlation overall:.gif)
I also ran the code with the regular setup (just same sector) and the modified setup (mix points from same sector and if not in the same sector, check to see if they're in adjacent sectors and mix them) just to see if it would be possible to get a well-defined pion peak and a more well-defined eta peak (than usual) in the same plot. Overall the number of reconstructed points increased by ~23%. Though the only noticeable improvement in resolution is in the 5-6 pT bin. Each plot will be labelled accordingly:
4-5 pT Same sector mixing: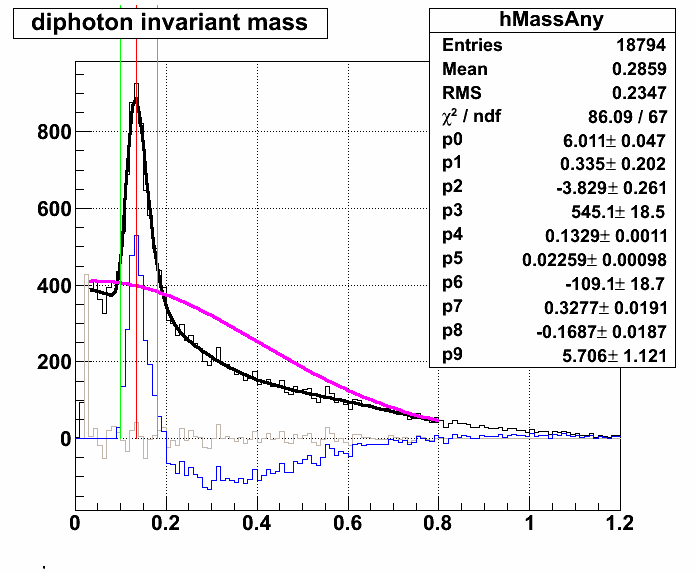
4-5 pT Same/Adjacent sector mixing:
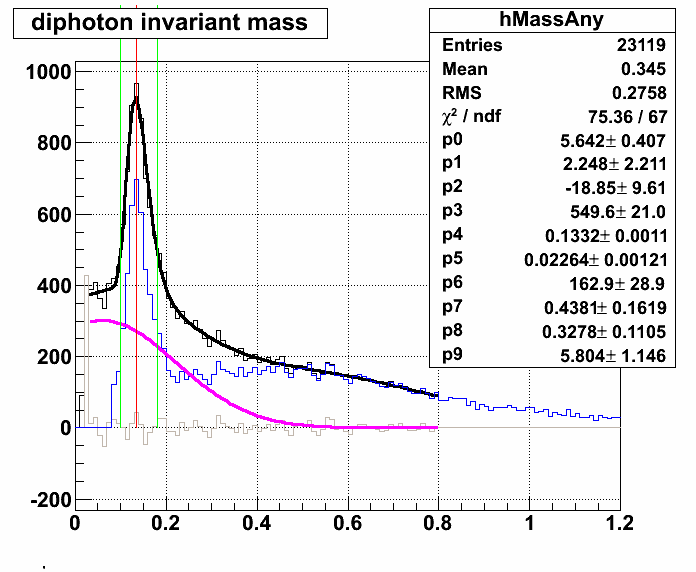
5-6 pT Same sector mixing: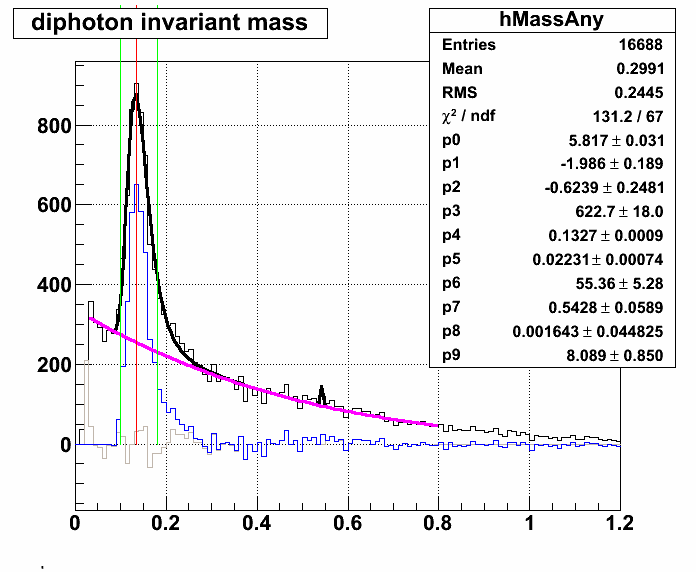
5-6 pT Same/Adjacent sector mixing: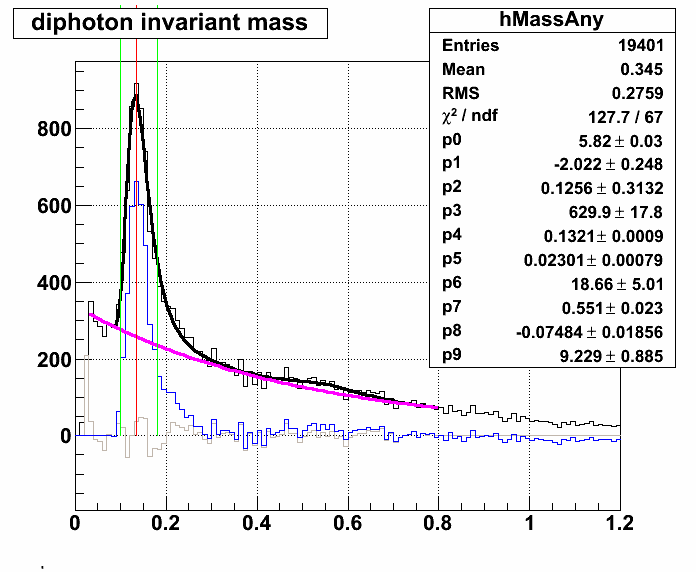
6-8 pT Same sector mixing: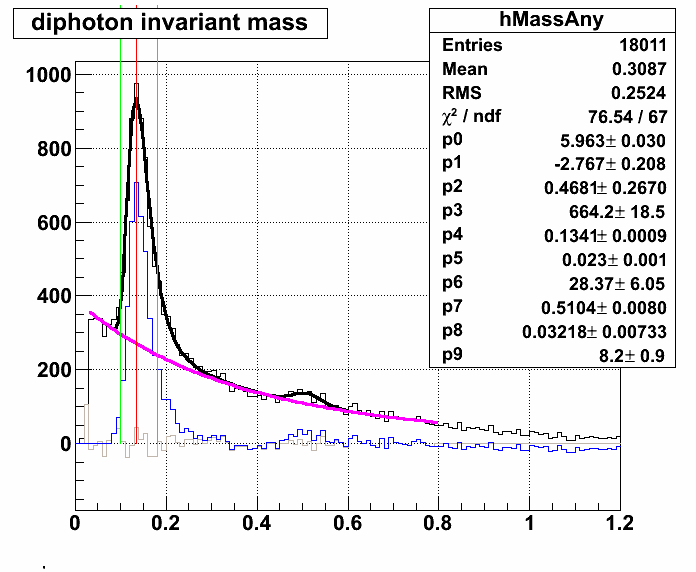
6-8 pT Same/adjacent sector mixing:
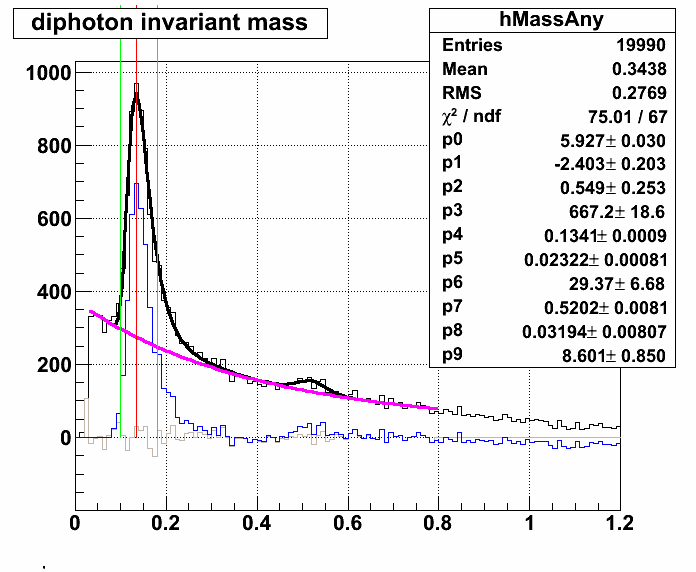
8-100 pT Same sector mixing:
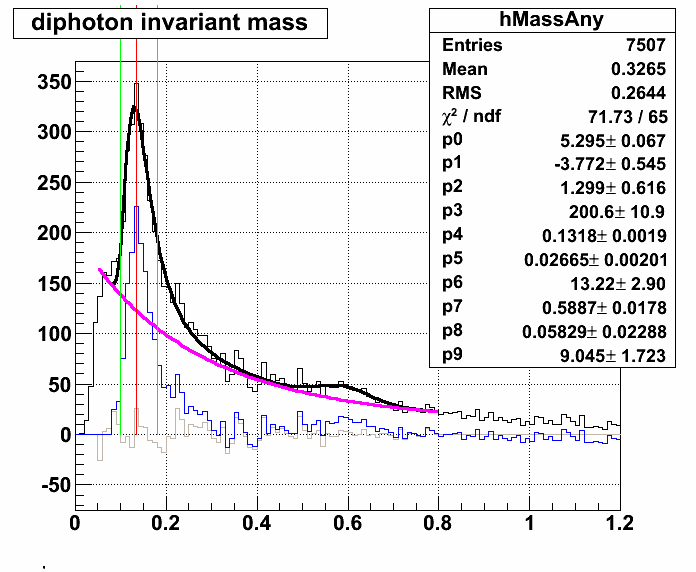
8-100 pT Same/adjacent sector mixing:
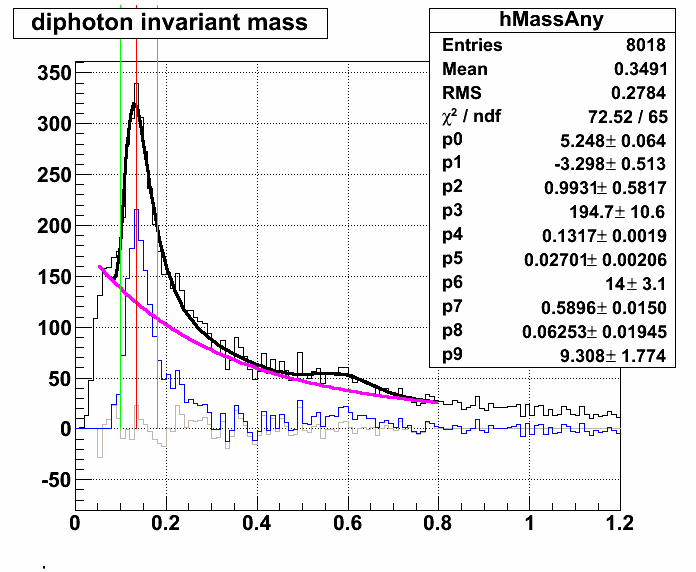
Lastly, two plots are presented showing a subtraction of the same sector mixing from the same/adjacent sector mixing. The first is for the 5-6 pT bin to examine the difference in eta peaks; the second is the same plot but for all pT.
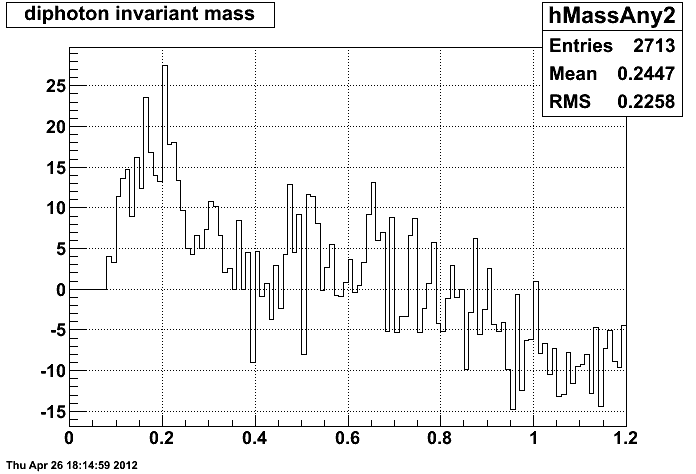
All pT:
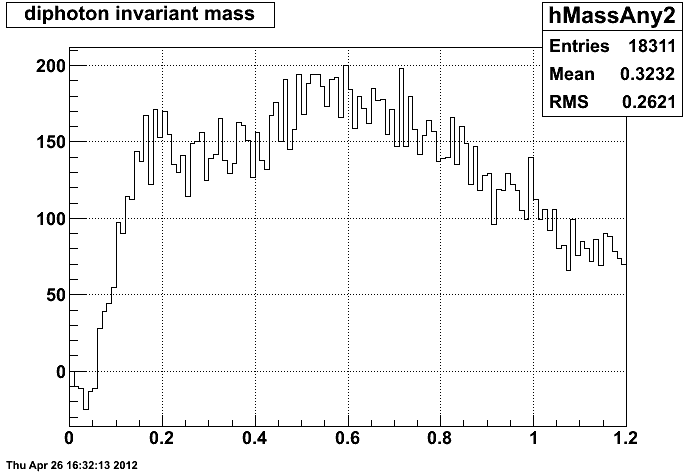
Most of the fit plots are remarkably similar without much change in resolution. More thinking will have to be done to determine the cause of this and the overall features of the invariant mass for the *just* adjacent sector mixing plot.
- ncolmena's blog
- Login or register to post comments
