First check of Run 12
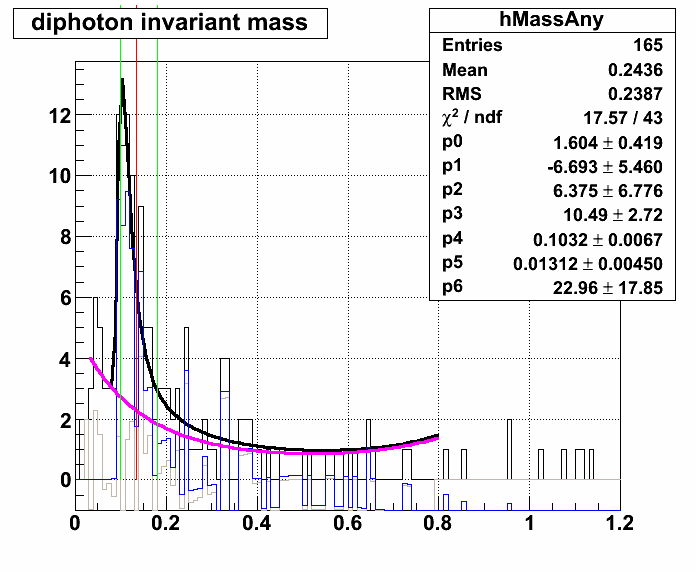
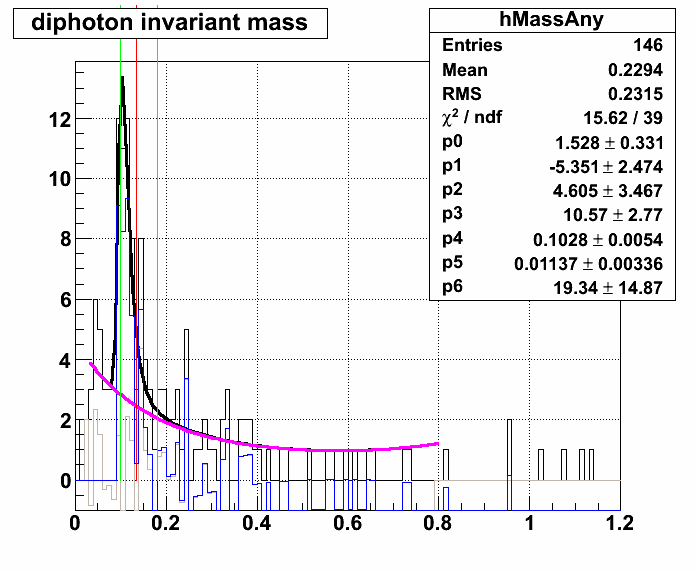
Here are two plots, each showing the full pT range. The first is from the L2Egamme trigger (36), the other is from the EHT0 trigger (370801). Although the latter has more events, the number of pions reconstructed is lower. In each case I did attempt to divide them up into two pT bins but the statistics are too low sadly. They both demonstrate a lower pT mass than from Run 9.
(Trig 36): 

(Trig 370801): 

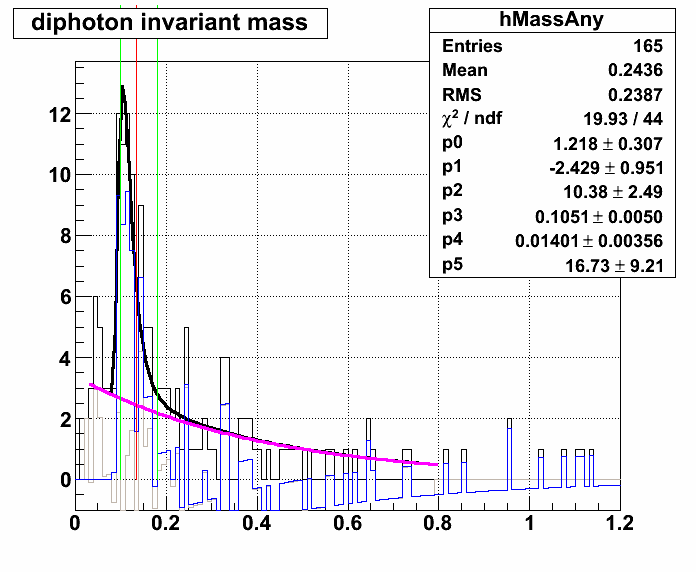
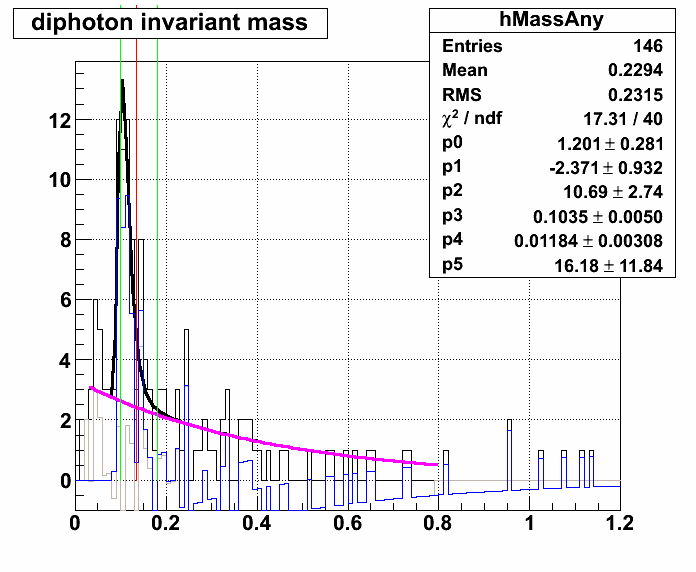
Here are the same two plots but without the curvature term on the exponential background function.
Trigger 36: 

Trigger 370801: 

The next step is to gain more statistics from another day or two of running to verify where the pion centroid actually is. Also from further inspection, the scale factor of 7.5% that was included with the run 9 gains (scaled up from the run 6 gains) was not included in these plots. So also with the next inspection, the 7.5% scale factor will have to be included.
Groups:
- ncolmena's blog
- Login or register to post comments
