2nd check of Run12
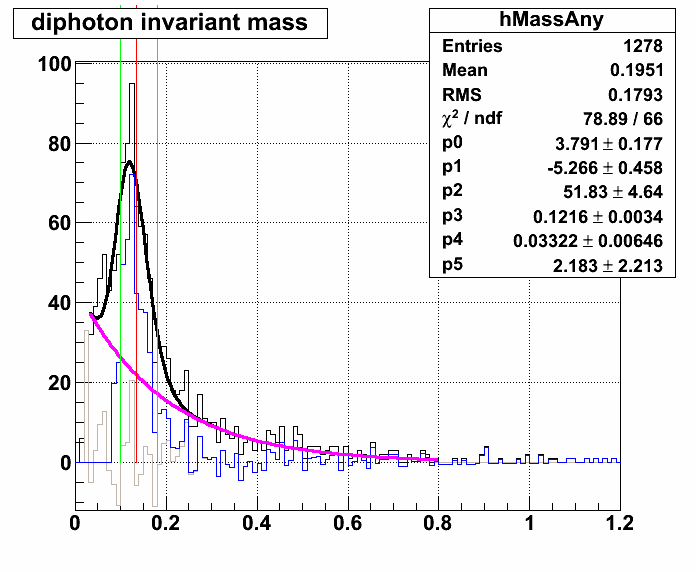
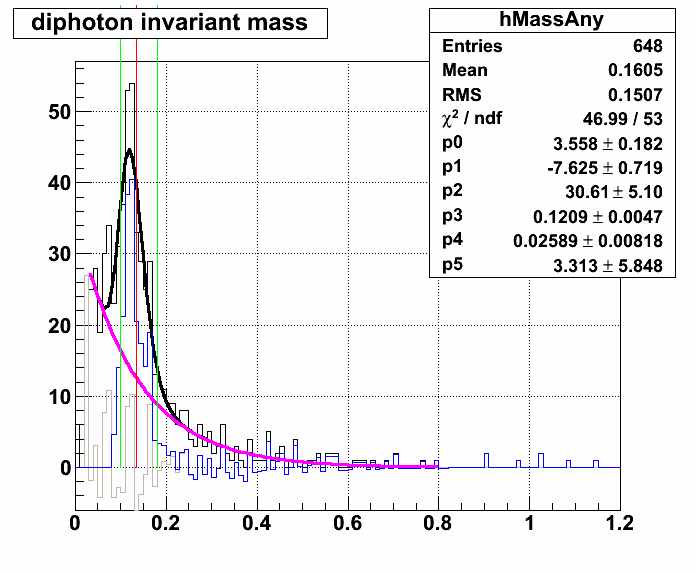
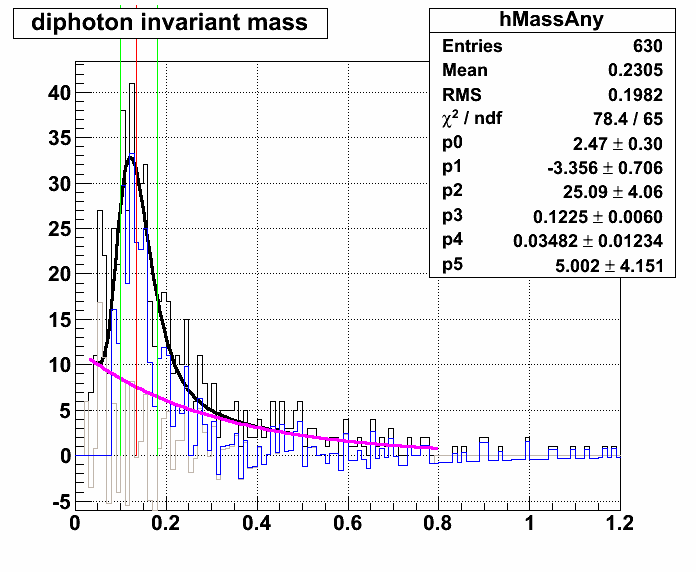
These plots include the data from the first check (i.e. the last blog posted BUT re-run with the energies scaled up by 7.5% in Weihong's pion finder macro to match the Run 9 gains) as well as the "good" runs from day 056 and 057 (also scaled up). Here is the runlist: STAR/files/userfiles/2992/Run12runlist.txt These were from the fast offline production, where for each file there are only 1000 events produced.
Here is the full pT range (0-100pT):

Now, split up into two pT ranges.
0-6.5 pT:

6.5-100 pT:

Now, here are the same three plots but using fixed width and asymmetry parameters of the ideal Run 9 values- 0.025 for the width and 7 for the asymmetry parameter.
0-100 pT:
.gif)
0-6.5 pT:
.gif)
6.5-100 pT:
.gif)
For some reason, after only a scale up factor of 7.5% from the first check, the centroid value has been raised by around 20%. Though if these were to be believed, it seems that the best value for the centroid in Run 12 would be 0.120 or 0.121 overall, a decrease of 10-11% from Run 9. But again, this discrepancy will have to be checked (next blog page).
- ncolmena's blog
- Login or register to post comments
