Comparison of centroid differences in Run12 data
The purpose of this look is to determine why after a 7.5% increase in adc energies the mass of the pion shows up ~20% larger (i.e. the centroid values) in the Second check: http://drupal.star.bnl.gov/STAR/blog/ncolmena/2012/feb/28/2nd-check-run12 compared to the First check: http://drupal.star.bnl.gov/STAR/blog/ncolmena/2012/feb/15/first-check-run-12. The discrepancy is most likely due to differing centroid width values and asymmetry parameters.
Here I provide two rather simple 3D plots comparing the centroid values in the same dataset (i.e. the data from the First check with ~150 or so pi0s reconstructed) as a function of fixed centroid width values and fixed asymmetry parameter values. It demonstrates that with various values of these fixed parameters, the centroid can vary by ~8%.
Here is the first plot that shows the centroid (z axis) from the data the first time (i.e. without the 7.5% scale factor). The centroid width (x axis, bottom right) is either 0.015 or 0.02 (note, though, on the plot I had incorrectly added these width values in as either 1.5 or 2, so a factor of 10 larger than what they actually are). The asymmetry parameter (y axis, bottom left) is either 0, 5, 10 or 15.
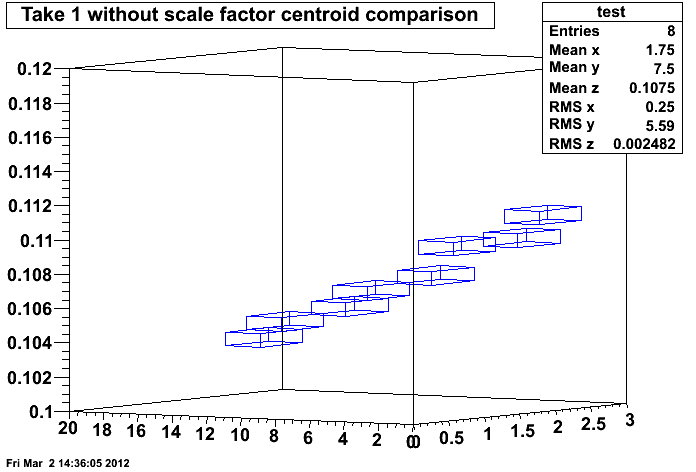
As stated, the centroid varies quite a bit with various values of these parameters. Also, the same plot is presented below that uses the data that includes the 7.5% scale factor (again, the width values are accidentally 1.5 or 2).
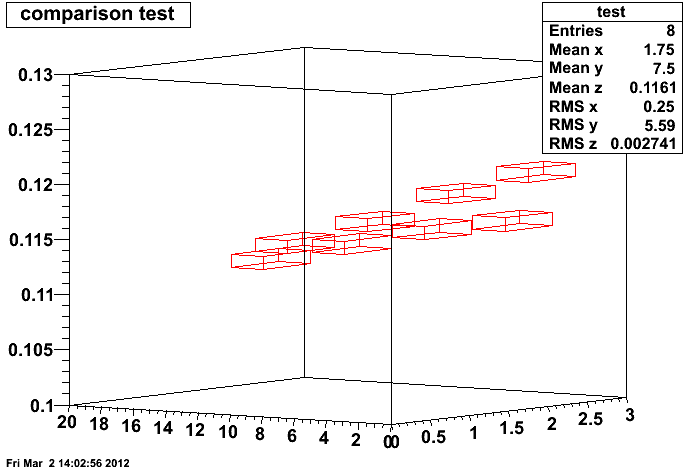
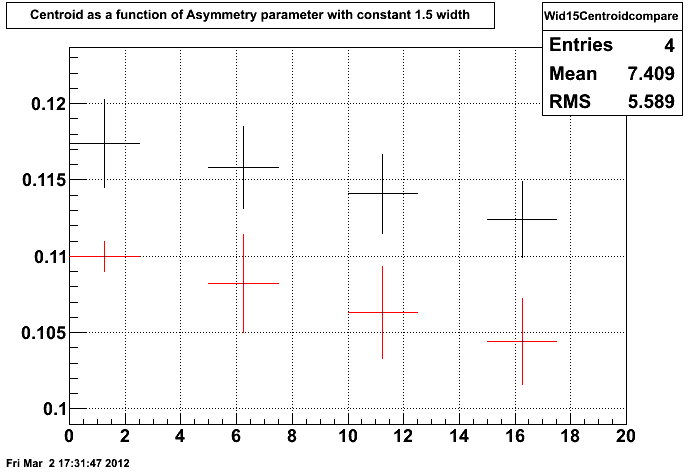
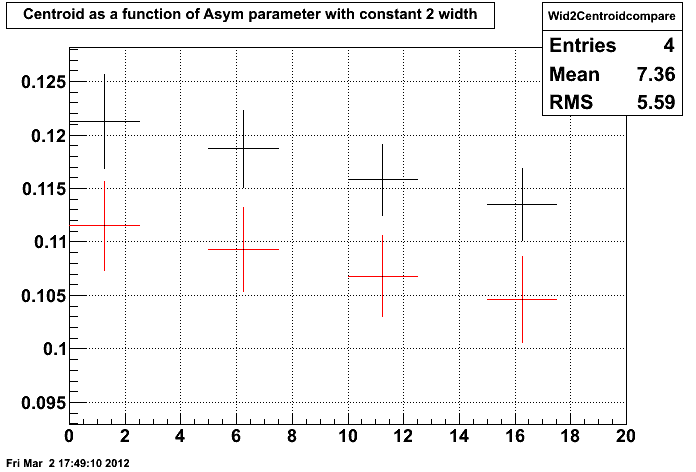
Initially we saw the centroid at around 0.103 or 0.104 and then after including the second data set (the larger set) that includes the scale factor, the centroid is seen up around 0.122 or so. Looking at these variations however it seems there most likely was not a 20% jump but just the 7.5%. For example, here are the 2D plots of the centroid vs. Asymmetry parameter demonstrating that for each Asymmetry value there is ~7.5% difference (using fixed centroid width values):
Note that in each case the red lines are the data without the 7.5% scale factor.
This is the plot with the constant centroid width of 0.015:
This is the plot with the constant centroid width of 0.02:
All in all, it seems that with the low statistics between the two datasets, the fitting function (when nothing is fixed) likes to take its own form which led to exploring why it gave ~20% difference between the two.
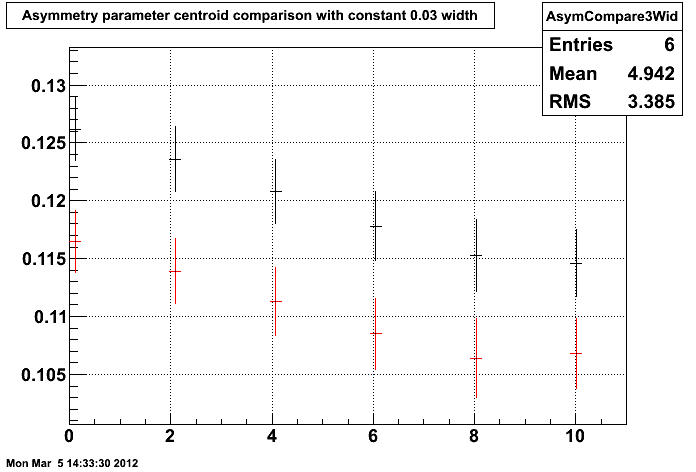
Here are two more 2D plots setup like the last two (i.e. centroid vs. asymmetry parameter comparing the scaled and non-scaled dataset) but these are for the 2nd, higher statistics dataset.
This first plot is for a width of 0.02:
.gif)
This plot is for a width of 0.03:
- ncolmena's blog
- Login or register to post comments
