Initial look at the 500 GeV run with the HV change for Run 12
Since the last blog post, there was a correction of 1% to the high voltages of the endcap detector. These are several pion mass plots demonstrating the high voltage change of 1% (during Run 12) to compensate for the gain change between Run 9 and Run 12. This is also using a scale factor of 7.5% (just as in the "2nd check of Run12" blog, the 7.5% scale factor in Weihong's pion finder macro) to reflect the gain change from Run 6 to Run 9.
These first four plots are four different pT slices on the dataset. The high pT slice is somewhat iffy-looking, so the last two plots I have posted are just two slices of the whole set.
1st plot: (0-7 pT)
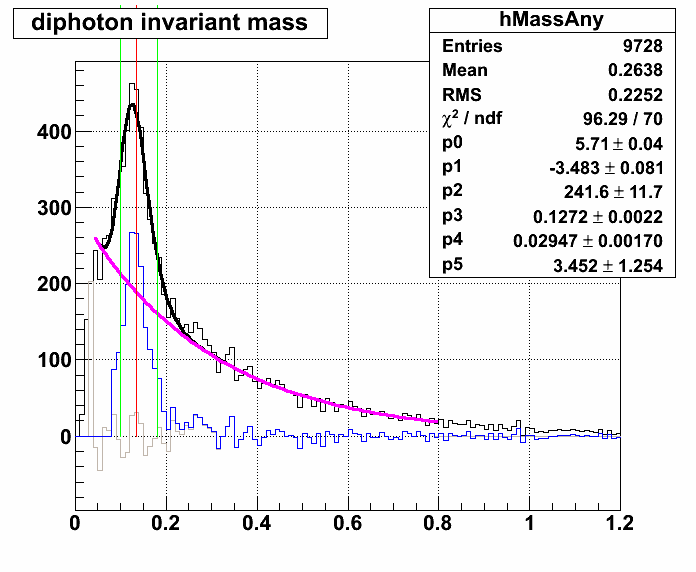
2nd plot: (7-9 pT)
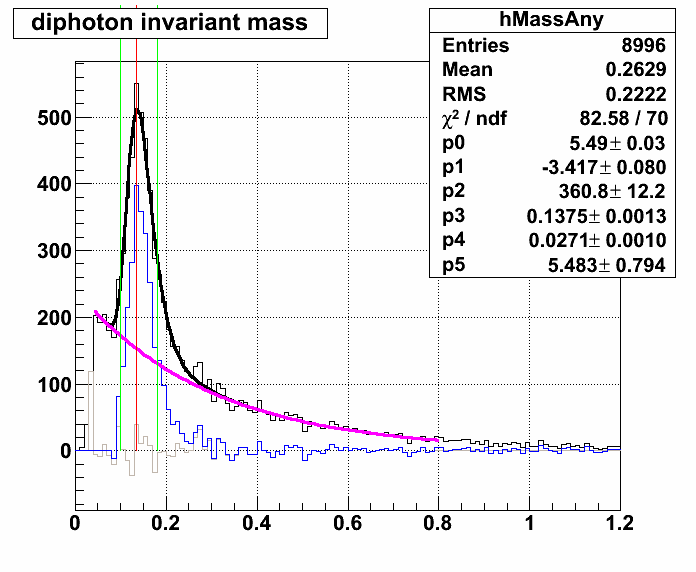
3rd plot: (9-11)
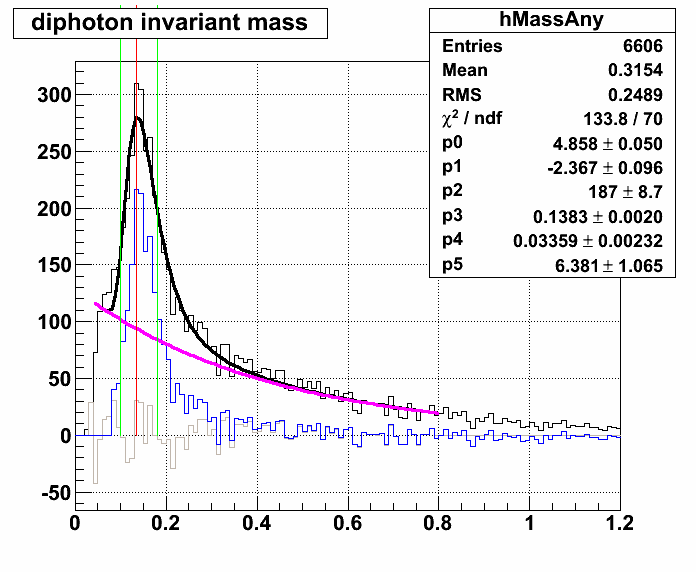
4th plot: (11-100 pT)
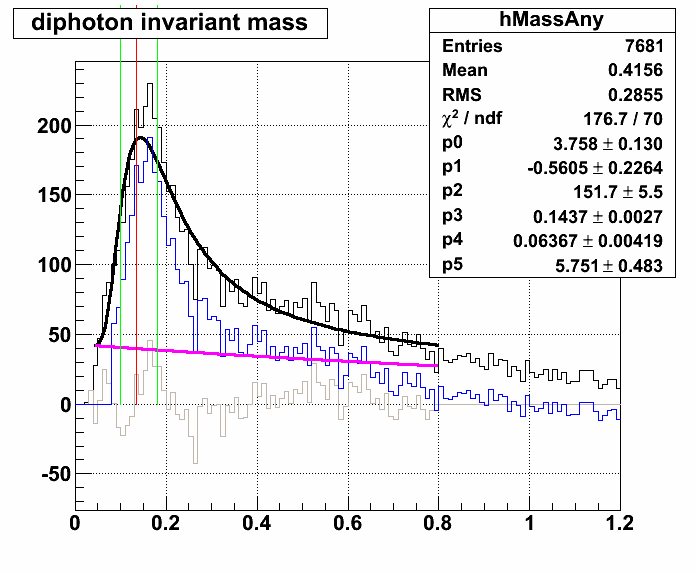
Last two plots (just the two separate slices).
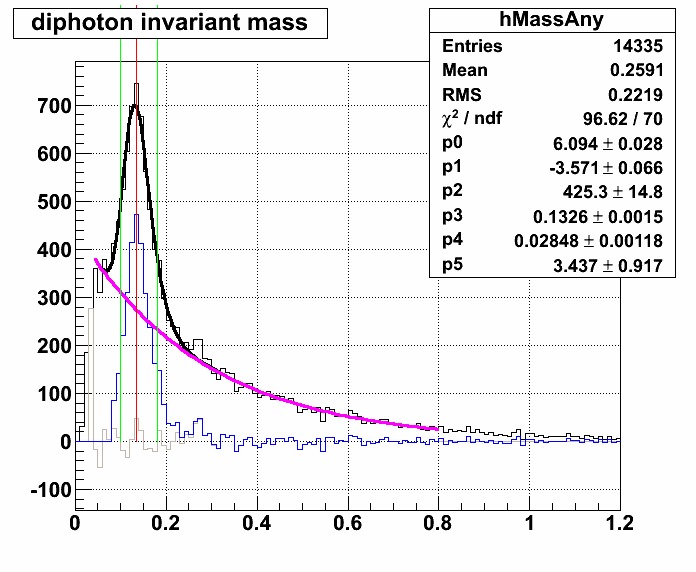
This is 0-8 pT:
This is 8-100 pT:
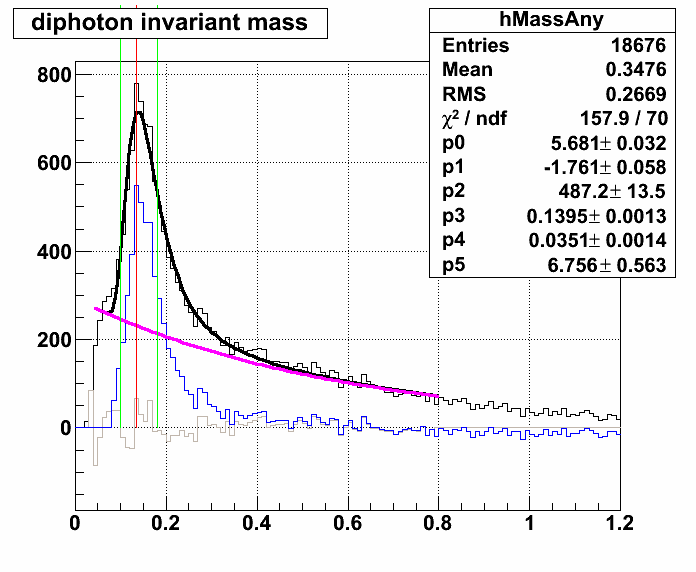
Conclusions: Overall, it seems the HV change put the mass back right around the proper energy. The pion centroid is close to the proper value (135 MeV).
- ncolmena's blog
- Login or register to post comments
