Update to adjacent sector mixing using Phi cuts
Hoping to result in a better signal to background ratio, the code was run over the same set of runs as described in the last blog page (http://drupal.star.bnl.gov/STAR/blog/ncolmena/2012/apr/25/pion-point-mixing-adjacent-sectors-study) plus 15 more (Still RUN 9!) (STAR/files/userfiles/2992/Pointmixingupdateruns.txt), but with an additional cut in the code that throws out gamma candidates if they are within one degree on either side of a sector boundary (i.e., +-15 degrees, +-45 degrees, etc.). The plots presented here are for only adjacent sector mixing (same sector and non-adjacent sector mixing is not considered).
Here is the invariant mass plot for all pT:
.gif)
When comparing this plot to the mass plot from the last blog page, it dropped the low mass background noticeably in a relative sense (more events, so more entries but relative to the eta peak the background is reduced when comparing this and the last plot).
Here is the pT vs. invariant mass plot:
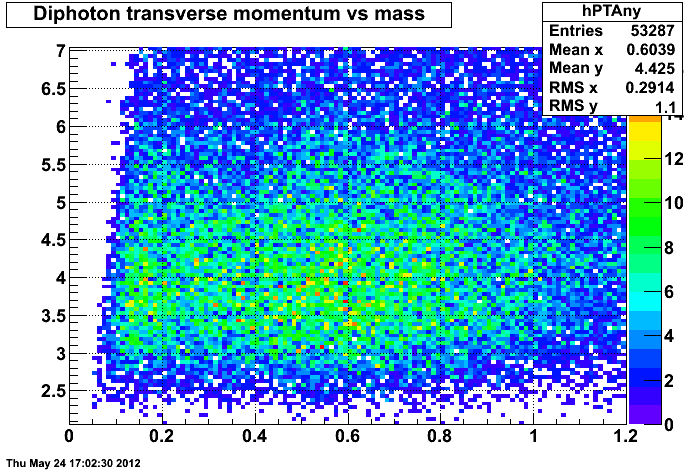
The difference between this and the plot from the last page is mostly a relative reduction in events below 300 MeV.
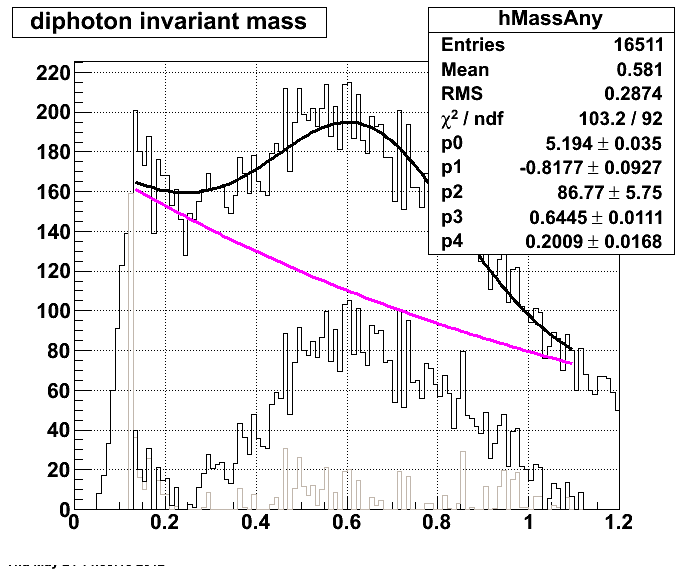
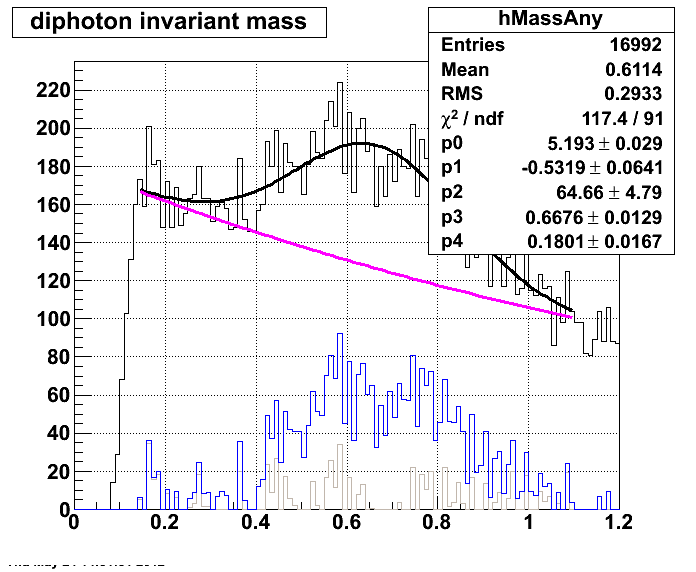
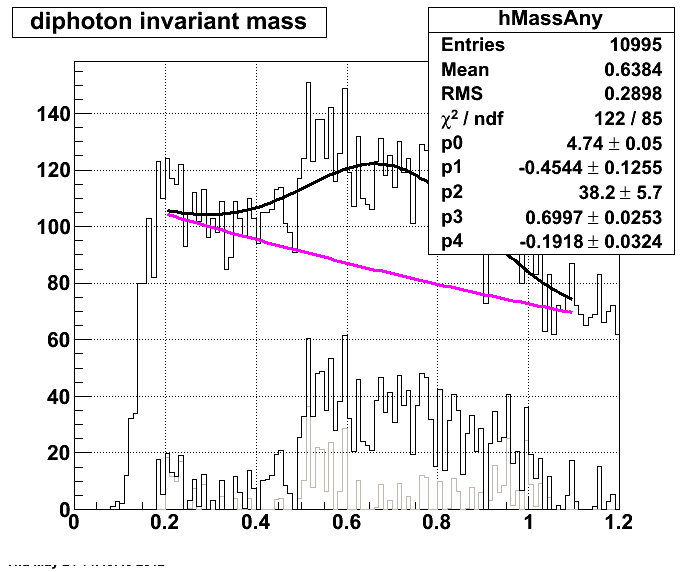
Additionally, here are three separate pT plots with fits applied. They are 2.0-4.0, 4.0-5.5 and 5.5-1000 respectively. The centroid of each is noticeably high but this may be a direct consequence of just cross sector point mixing providing more of a high mass background.
Here is a mass plot of only adjacent sector mixing with the cuts on phi using data from run 6 (25 runs, the same amount of runs used to look at run 9 in this page) rather than run 9 for comparison:
.gif)
It seems that there are fewer reconstructed events in run 6 compared to run 9, though I'm unsure of why there is such a large difference.
As a last check, I ran over a number of Run 6 simulation files in order to compare the combinatorics of the simulation to the data's background. This is in hopes to subtract off the real etas and figure out what the combinatorics actually look like to improve the actual data analysis. Here is the mass plot:
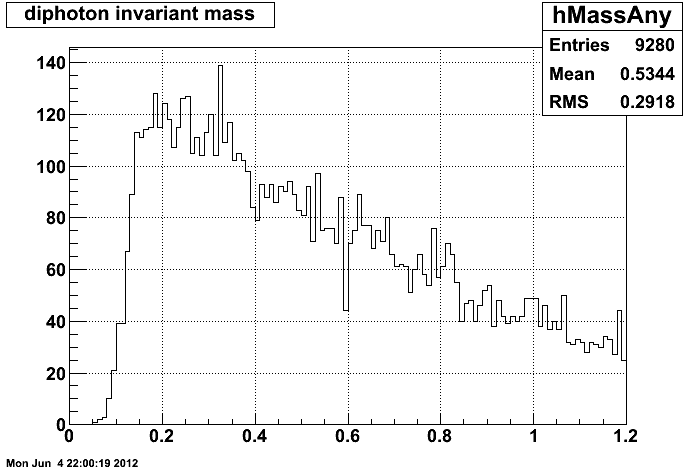
For some reason, there is no reconstructed eta peak in the simulation. To ensure the modifications to the code are working at least somewhat as expected, I am throwing single etas using a simple Monte Carlo setup.
- ncolmena's blog
- Login or register to post comments
