Run17 IFF A_{UT} Measurement Preliminary Request Page
Updated on Tue, 2023-08-08 12:30. Originally created by nghimire on 2023-07-19 08:52.
Figures :
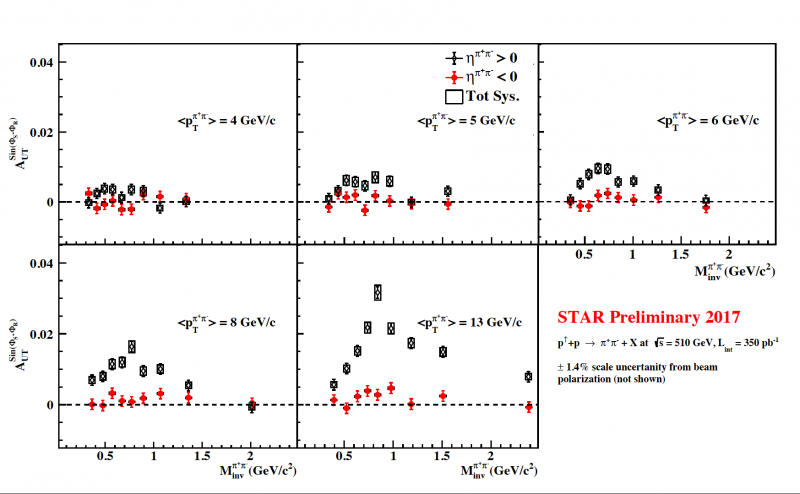
Figure 1 : $A_{UT}$ vs $M_{inv}^{\pi^{+}\pi^{-}}$ in forward (\eta^{\pi{+}\pi^{-}}>0) (Black) and backward (\eta^{\pi{+}\pi^{-}}>0) (red) region for five $p_{T}^{\pi^{+}\pi^{-}}$ bins. Open box represents the total systematic uncertainty from particle identification and trigger bias effect.
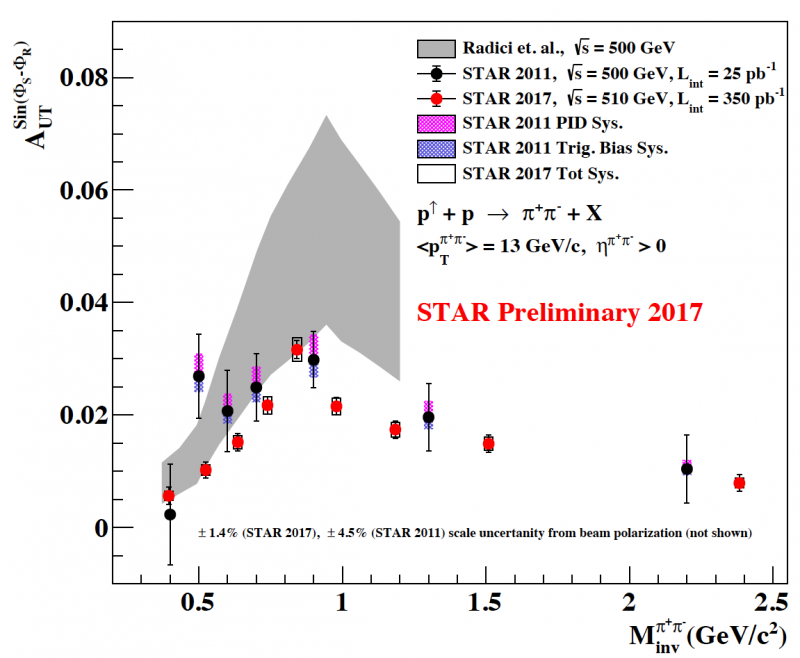
Figure 2 : STAR 2017(Red) result compared with STAR 2011(Black) result for $A_{UT}$ vs $M_{inv}^{\pi^{+}\pi^{-}}$ in forward (\eta^{\pi{+}\pi^{-}}>0) region for highest $p_{T}^{\pi^{+}\pi^{-}}$ bin. Open box represents the total systematic uncertainty from particle identification and trigger bias effect. The gray band represents the theoretical predictions for $\sqrt{s}= 500$ GeV from fit to SIDIS and $e^{+}e^{-}$ data.
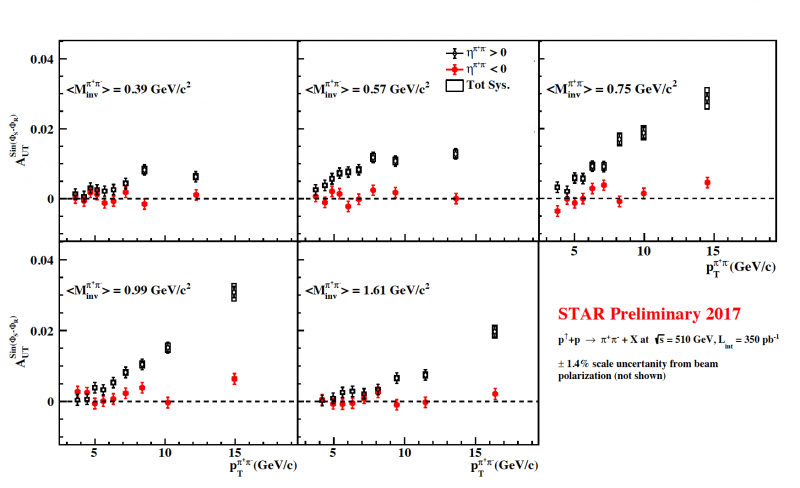
Figure 3 : $A_{UT}$ vs $p_{T}^{\pi^{+}\pi^{-}}$ in forward (\eta^{\pi{+}\pi^{-}}>0) (Black) and backward (\eta^{\pi{+}\pi^{-}}>0) (red) region for five $M_{inv}^{\pi^{+}\pi^{-}}$ bins. Open box represents the total systematic uncertainty from particle identification and trigger bias effect.
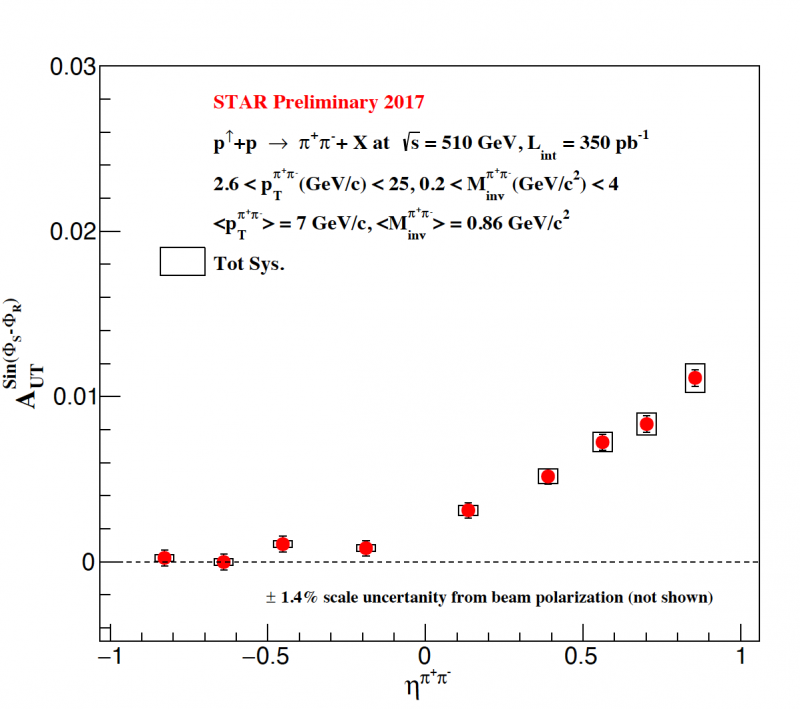
Figure 4 : $A_{UT}$ vs $\eta^{\pi^{+}\pi^{-}}$ for integrated $p_{T}^{\pi^{+}\pi^{-}}$ bins. Open box represents the total systematic uncertainty from particle identification and trigger bias effect.
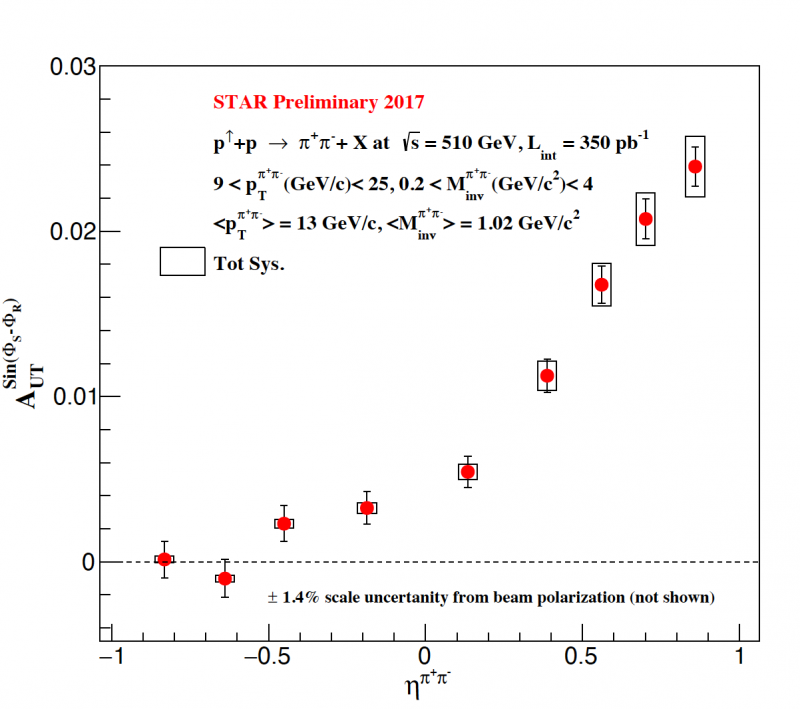 A_UT_Eta_highestpT
Figure 5 : $A_{UT}$ vs $\eta^{\pi^{+}\pi^{-}}$ for highest$p_{T}^{\pi^{+}\pi^{-}}$ bins. Open box represents the total systematic uncertainty from particle identification and trigger bias effect.
Binning
2D Binning for A_{UT} vs M_{inv}^{\pi^{+}\pi^{-}} plot:
Binning for A_{UT} vs \eta^{\pi^{+}\pi^{-}} plot:
Precise Measurement of Transverse Spin Dependent Azimuthal Correlations of Charged Pion Pairs in p$\uparrow$p collisions at $\sqrt{s}$ = 510 GeV at STAR using Run17 data.
(Preliminary Request)
Detailed Presentations : 1. Preliminary Request Presentation
Dataset :
- Data format : picoDst
- Data stream : st_physics
- Run year : 2017
- Production : P20ic, SL22b
- Center-of-mass energy, $\sqrt{s}$ = 510 GeV
- $L_{int}$ = 350 $pb^{-1}$
Embedding(Locally produced):
- Pythia : 6.4.28
- Tune : Perugia 2012(370)
- PARP(90): 0.213
- Chain : "DbV20200225 DbV20200225_emc_Calibrations pp2017a StiCA btof mtd mtdCalib PicoVtxDefault PicoCovMtxWrite fmsDat fmsPoint fpsDat BEmcChkStat OSpaceZ2 OGridLeak3D -evout -hitfilt"
- Vetex Spread and Offset
- $\sigma_{x,y,z} = 0.035, 0.015, 40.0 cm$
- $z_{offset}$ = -2.0 cm
- Partonic pT:
- {2,3,4,5,7,9,11,15,20,25,35,45,55,-1}
Event and Track level Cut :
- Z-vertex : <|90| cm
- Z-vertex rank > 10^6
- Triggers : JP2, JP1*VPDMB30, JP0*VPDMB30, BHT3, BHT2*BBCMB, BHT1*VPDMB30, VPDMB30
- Spin Config: Blue and Yellow transversely polarized
- Tracks : Primary
- Track DCA : <1 cm
- Track Momentum > 2 GeV/c
- Track Quality Cuts
- nHitsFit > 15, nHitsdEdx > 20, nHitsFit/nHitsFitPoss > 0.51
- Track Eta : -1< $eta$ < 1
- Cone Cut : 0.7
- Pion Selection : -1 < $n\sigma_{\pi}^{TPC}$ < 2 and $n\sigma_{\pi}^{TPC}$ > $n\sigma_{\pi}^{TOF}$ polynomial cut, (if TOF is available)
- $n\sigma_{\pi}^{TOF}$ polynomial cut : 0.0081 * pow($n\sigma_{\pi}^{TOF}$,3) + 0.1217 * pow($n\sigma_{\pi}^{TOF}$,2) + 0.5422 * $n\sigma_{\pi}^{TOF}$ -2.2727
Figures :

Figure 1 : $A_{UT}$ vs $M_{inv}^{\pi^{+}\pi^{-}}$ in forward (\eta^{\pi{+}\pi^{-}}>0) (Black) and backward (\eta^{\pi{+}\pi^{-}}>0) (red) region for five $p_{T}^{\pi^{+}\pi^{-}}$ bins. Open box represents the total systematic uncertainty from particle identification and trigger bias effect.

Figure 2 : STAR 2017(Red) result compared with STAR 2011(Black) result for $A_{UT}$ vs $M_{inv}^{\pi^{+}\pi^{-}}$ in forward (\eta^{\pi{+}\pi^{-}}>0) region for highest $p_{T}^{\pi^{+}\pi^{-}}$ bin. Open box represents the total systematic uncertainty from particle identification and trigger bias effect. The gray band represents the theoretical predictions for $\sqrt{s}= 500$ GeV from fit to SIDIS and $e^{+}e^{-}$ data.

Figure 3 : $A_{UT}$ vs $p_{T}^{\pi^{+}\pi^{-}}$ in forward (\eta^{\pi{+}\pi^{-}}>0) (Black) and backward (\eta^{\pi{+}\pi^{-}}>0) (red) region for five $M_{inv}^{\pi^{+}\pi^{-}}$ bins. Open box represents the total systematic uncertainty from particle identification and trigger bias effect.

Figure 4 : $A_{UT}$ vs $\eta^{\pi^{+}\pi^{-}}$ for integrated $p_{T}^{\pi^{+}\pi^{-}}$ bins. Open box represents the total systematic uncertainty from particle identification and trigger bias effect.
 A_UT_Eta_highestpT
Figure 5 : $A_{UT}$ vs $\eta^{\pi^{+}\pi^{-}}$ for highest$p_{T}^{\pi^{+}\pi^{-}}$ bins. Open box represents the total systematic uncertainty from particle identification and trigger bias effect.
Binning
2D Binning for A_{UT} vs M_{inv}^{\pi^{+}\pi^{-}} plot:
pT_bin[5]={2.60, 4.628, 5.643, 6.979, 9.265, 25};
Minv_bin[5][9]={0.20, 0.3740, 0.4554, 0.5327, 0.6207, 0.7190, 0.8235, 0.9685, 1.175, 4.000}, {0.20, 0.3916, 0.4799, 0.5640, 0.6597, 0.7591, 0.8793, 1.0550, 1.327, 4.000}, {0.20, 0.4049, 0.4967, 0.5874, 0.6877, 0.7857, 0.9171, 1.1138, 1.4390, 4.000}, {0.200, 0.4249, 0.5217, 0.6222, 0.7244, 0.8255, 0.9678, 1.1913, 1.578, 4.000}, {0.2000, 0.4688, 0.5805, 0.6900, 0.7870, 0.9041, 1.067, 1.313, 1.768, 4.00}};
2D Binning for A_{UT} vs M_{pT}^{\pi^{+}\pi^{-}} plot:
Minv_bin[5]={0.20, 0.4848, 0.6565, 0.8431, 1.1710, 4.000};
pT_bin[5][9]={ {2.60, 3.982, 4.453, 4.914, 5.407, 5.982, 6.7080, 7.740, 9.540, 25},{2.600, 4.1065, 4.620, 5.1220, 5.6850, 6.350, 7.200, 8.400, 10.500, 25},{2.600, 4.183, 4.737, 5.299, 5.920, 6.657, 7.598, 8.939, 11.260, 25},{2.600, 4.160, 4.715, 5.285, 5.933, 6.710, 7.710, 9.120, 11.584, 25},{2.600, 4.615, 5.286, 5.957, 6.705, 7.590, 8.708, 10.280, 12.990, 25}};
pT_bin[5][9]={ {2.60, 3.982, 4.453, 4.914, 5.407, 5.982, 6.7080, 7.740, 9.540, 25},{2.600, 4.1065, 4.620, 5.1220, 5.6850, 6.350, 7.200, 8.400, 10.500, 25},{2.600, 4.183, 4.737, 5.299, 5.920, 6.657, 7.598, 8.939, 11.260, 25},{2.600, 4.160, 4.715, 5.285, 5.933, 6.710, 7.710, 9.120, 11.584, 25},{2.600, 4.615, 5.286, 5.957, 6.705, 7.590, 8.708, 10.280, 12.990, 25}};
Binning for A_{UT} vs \eta^{\pi^{+}\pi^{-}} plot:
eta_bin[9]={-1.200, -0.7243, -0.5539, -0.3410, -0.0225, 0.2833, 0.4852, 0.6346, 0.7695, 1.200};
»
- nghimire's blog
- Login or register to post comments
