Fixed frequency in asymmetry fits and radial dependence graph
Yesterday I began looking at some statistics to begin investigating a radial dependence for asymmetry in the ZDC. These are seperated into four groups, combinations of the categories East/West and Blue/Yellow. The East Blue and West Yellow are consistant with zero as expected. For East Yellow and West Blue the hits vs phi were fit to sine function amplitude representing the physics asymmetry. These were then seperated into four categories for comparing radial dependence.
I also compared the fit with a varying frequency to a set frequency of 1.
The first group is total over the whole ZDC:
Before(varying freq) After(fixed freq.)
East
Yellow
chi 12.6/6 (2.10) 13.63/7 (1.947)
prob 0.04976 0.05819
Amp 0.03047+0.002113 0.02901+0.001101
omega 0.9081+0.09695 1+0
phase 0.1496+0.03646 0.1641+0.03499
Blue
chi 3.005/6 (0.5008) 5.863/7 (0.8376)
prob 0.8082 0.5558
Amp 0.003133+0.0009764 0.003076+0.001099
omega 1.877+0.6244 1+0
phase 0.1535+0.5991 0.2044+0.3303
West
Yellow
chi 1.785/6 (0.2975) 3.016/7 (0.4309)
prob 0.9384 0.8835
Amp 0.001734+0.001017 0.00129+0.0009711
omega 2.457+0.5286 1+0
phase -0.9536+0.5284 0.173+0.6765
Blue
chi 18.69/6 (3.115) 18.82/7 (2.88)
prob 0.004715 0.008754
Amp 0.03525+0.00235 0.03453+0.0009725
omega 0.9659+0.0957 1+0
phase -0.01774+0.02441 -0.0188+0.0252
Group of Inner radius:
Before After
East
Yellow
chi 3.746/5 (0.7492) 6.536/6 (1.0893)
prob 0.5866 0.3659
Amp 0.0224+0.002685 0.02666+0.003177
omega 1.631+0.297 1+0
phase 0.4175+0.1359 0.2547+0.09473
Blue
chi 3.568/5 (0.7136) 3.582/6 (0.597)
prob 0.6131 0.7331
Amp 0.3795+115.2 -0.002107+0.002964
omega -0.003439+1.055 1+0
phase -0.003014+0.9243 0.6706+1.314
West
Yellow
chi 2.737/5 (0.5474) 2.894/6 (0.4823)
prob 0.7405 0.822
Amp 0.001964+0.002435 -0.001566+0.001917
omega -1.708+1.482 1+0
phase -1.015+1.047 0.7876+1.227
Blue
chi 2.267/5 (0.4534) 4.376/6 (0.7293)
prob 0.8111 0.626
Amp 0.0235+0.001654 0.03011+0.00201
omega 1.714+0.3615 1+0
phase 0.06489+0.1194 0.05465+0.06054
Middle radius
Before After
East
Yellow
chi 2.263/5 (0.4526) 3.406/6 (0.5677)
prob 0.8117 0.7564
Amp 0.0388+0.006232 0.03473+0.001965
omega 0.8238+0.19 1+0
phase 0.08196+0.05462 0.1055+0.057
Blue
chi 4.247/5 (0.8494) 4.344/6 (0.7240)
prob 0.5144 0.6302
Amp 0.00386+0.002011 0.004102+0.001966
omega 1.27+0.8712 1+0
phase 0.2492+0.6401 0.2621+0.4821
West
Yellow
chi 3.546/5 (0.7092) 3.811/6 (0.6352)
prob 0.6164 0.7023
Amp 0.004243+0.001749 0.004073+0.001695
omega 1.248+0.4346 1+0
phase 0.7081+0.3916 0.6667+0.4111
Blue
chi 4.729/5 (0.9458) 4.922/6 (0.8203)
prob 0.4499 0.5539
Amp 0.04204+0.004432 0.04048+0.00174
omega 0.9381+0.1472 1+0
phase -0.002544+0.03772 -0.001209+0.04015
Outer radius
Before After
East
Yellow
chi 23.32/5 (4.664) 26.03/6 (4.338)
prob 0.0002928 0.0002201
Amp 0.03412+0.005418 0.02909+0.001347
omega 0.7721+0.1679 1+0
phase 0.08971+0.04412 0.1236+0.04534
Blue
chi 4.724/5 (0.9448) 10.61/6 (1.768)
prob 0.4505 0.1011
Amp 0.004204+0.001258 0.003392+0.001345
omega 2.085+0.5322 1+0
phase 0.3936+0.4883 0.2193+0.3892
West
Yellow
chi 3.968/5 (0.7936) 4.104/6 (0.6840)
prob 0.5541 0.6626
Amp 1.014+90.55 0.002582+0.001294
omega 0.002101+0.189 1+0
phase -0.0007083+0.06388 -0.4427+0.4773
Blue
chi 9.699/5 (1.9398) 14.34/6 (2.390)
prob 0.08421 0.02604
Amp 0.02991+0.001512 0.03322+0.001314
omega 1.251+0.1036 1+0
phase -0.06828+0.04821 -0.0478+0.0364
In most cases, the East Yellow and Blue West fits had better chi squareds with the frequency fixed as well as higher amplitudes.
Using this data I then generated the blelow figures for the East Yellow and Blue West asymmetry vs radial position
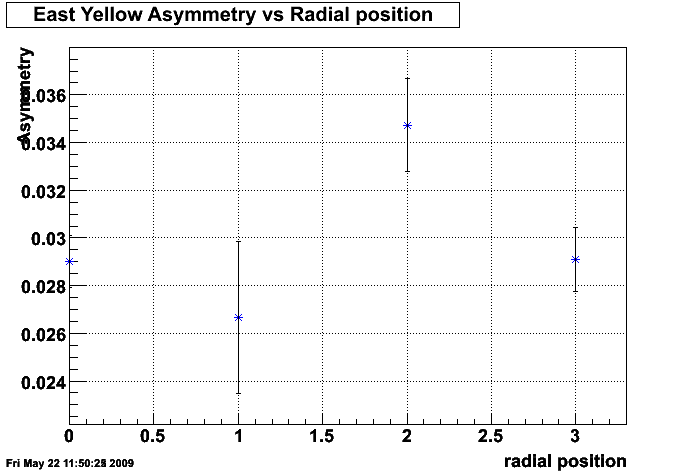
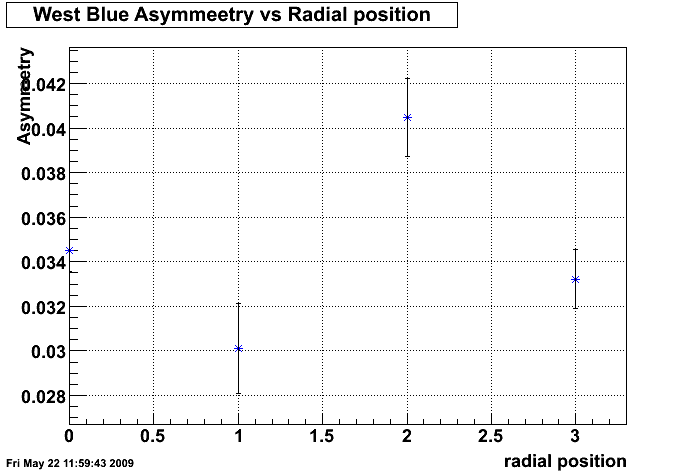
Note that the '0' radial postion is the total for the entire zdc and the 1 position is the inner radius, 2 is middle radis, and 3 is outer radius. Bothplots are very similar with some interesting features. Most notable is that the middle radius is significantly higher in asymmetry than the the inner, outer, or total. The decreasing errors with increasing radius are due to the fact there are more sections in the outer radii than inner.
- nkellams's blog
- Login or register to post comments