Simulated data for Asymmetry calculation
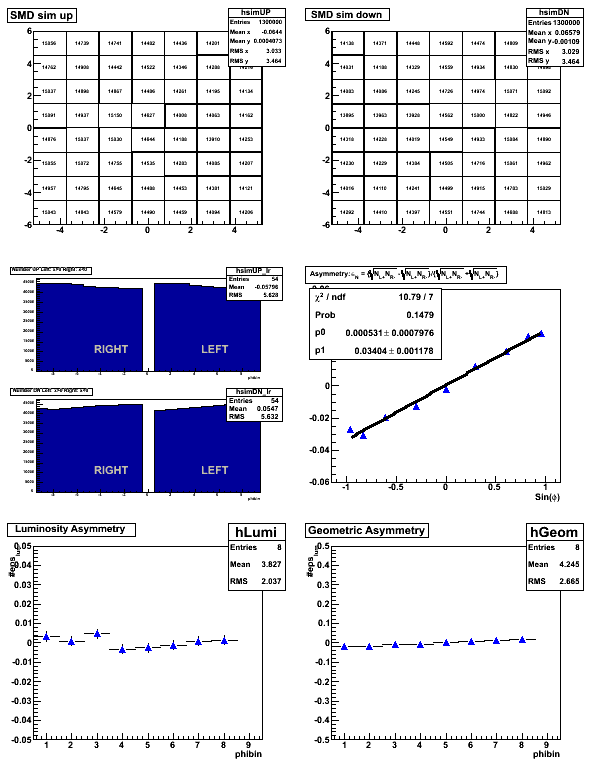
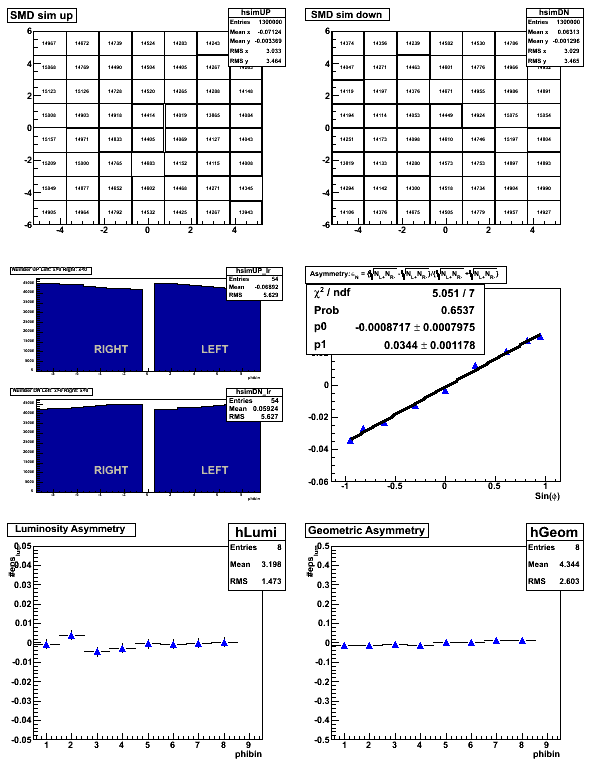
Created simulated data to generate the 2D coincidece and then created the asymmetry plots from these simulated datas. The simulation data was generated with a 3.5% physics asymmetry and was put into the asymmetry calculation to see if the the same value was returned. The right hand graph in the middle row of the six-graph panels is the asymmetry we are currently interested in. Below I have shown two sets of simulated data each with different seeds for the TRandom3 generator. The reduced chi-squared seems to vary significantly with a change of the random number generator seed. In the future I will attempt to reduce this. It can be seen on the statistics output for this asymmetry graph that in both cases the asymmetry is less than one standard deviation away from the 3.5% that it was generated with. This indicates that our method calculating the asymmetry is in line with expected values. The simulation also shares the ~30 sigma deviation from zero for the asymmetry.
using TRandom3(122)

using TRandom3(133)

The program that creates this can by found on my directory at rcf (nkellams). It is is phiAsymmetry_Sim.C dependent on phiAsymmetry_LinSim.C and phibins02.h
- nkellams's blog
- Login or register to post comments
