FGT Event Display Progress
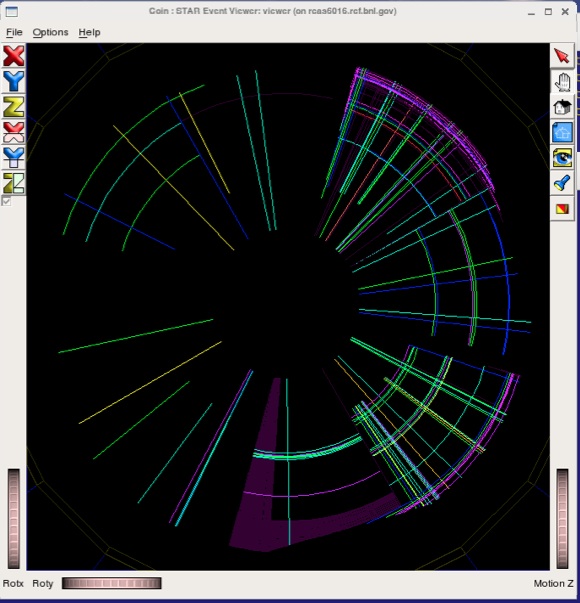
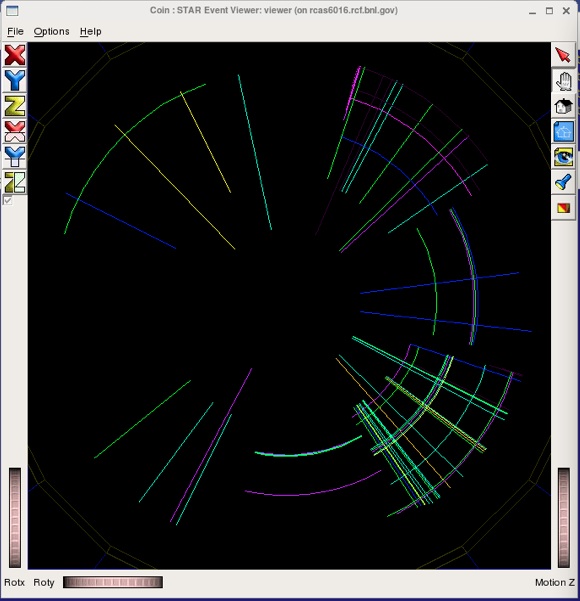
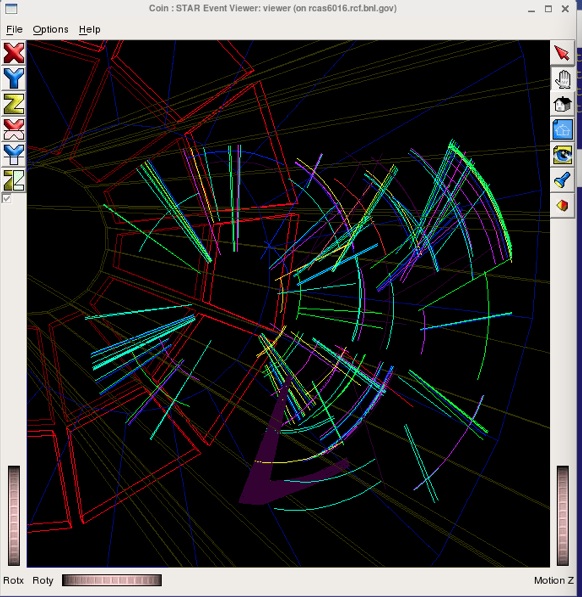
The first two figures below show "hit" strips in the FGT looking end on with no 3D perspective. Color indicates increasing ADC-ped value coded with rainbow colors (red being the lowest intensity and purple being the highest). The large section of purple strips in Disc 4 Quad B show hit with a full value of the ADC register in every event. This is probably an indication of a hardware failure. These are surpressed in other plots by masking out hits which show an ADC in the higher time bins. This mask may also remove some real data. A better method should be used to mask out bad channels.
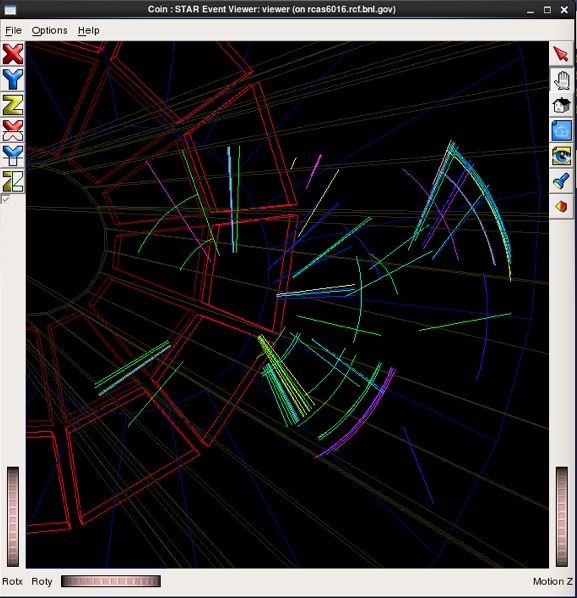
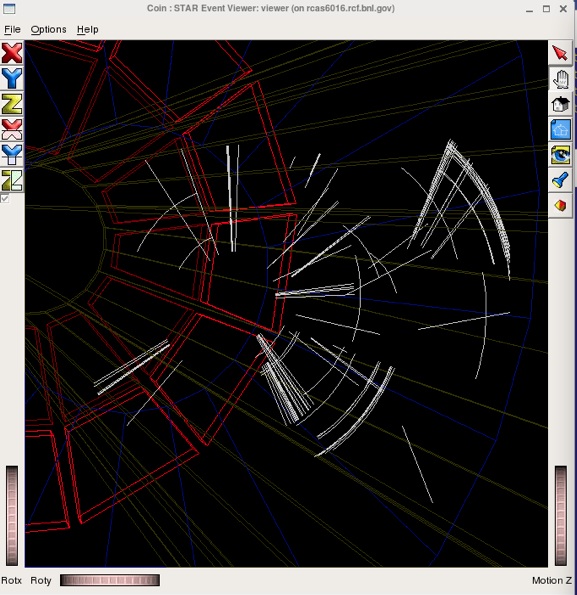
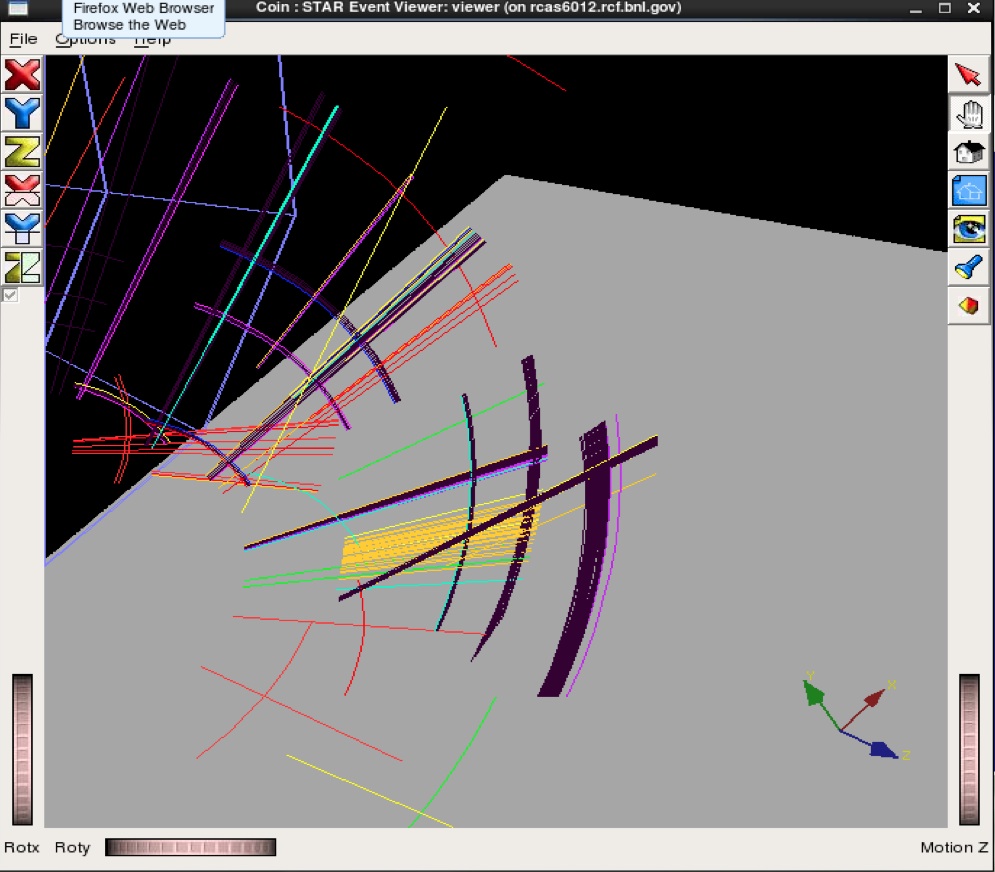
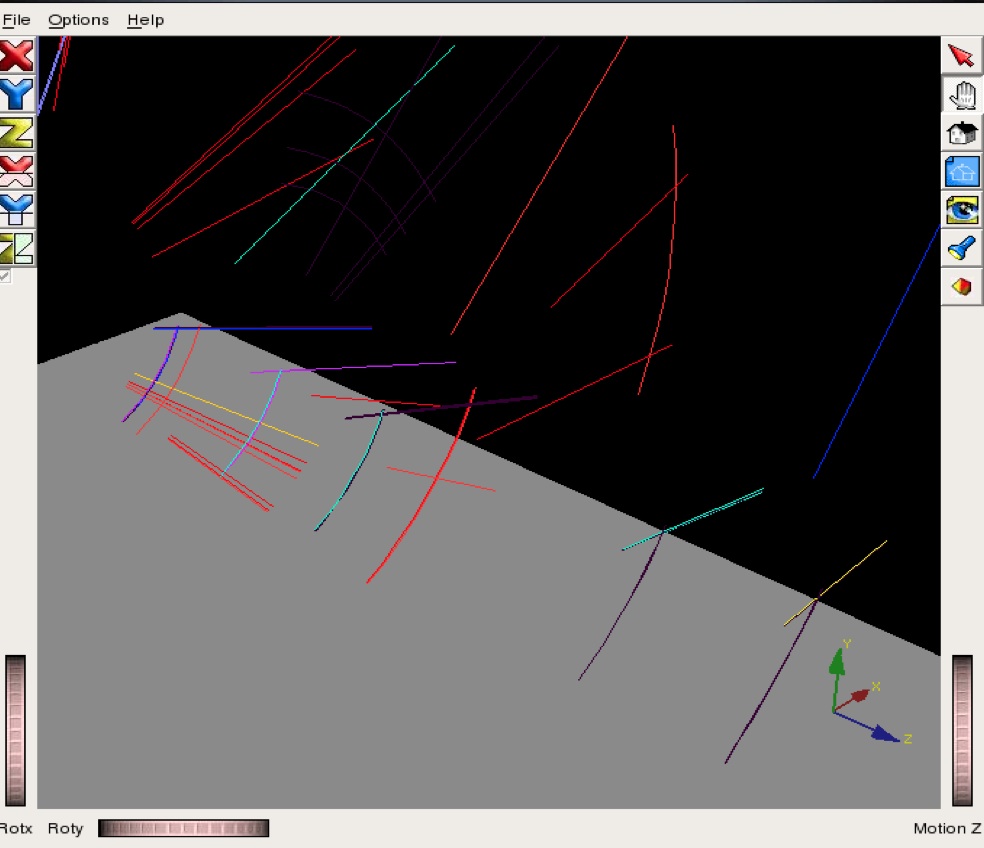
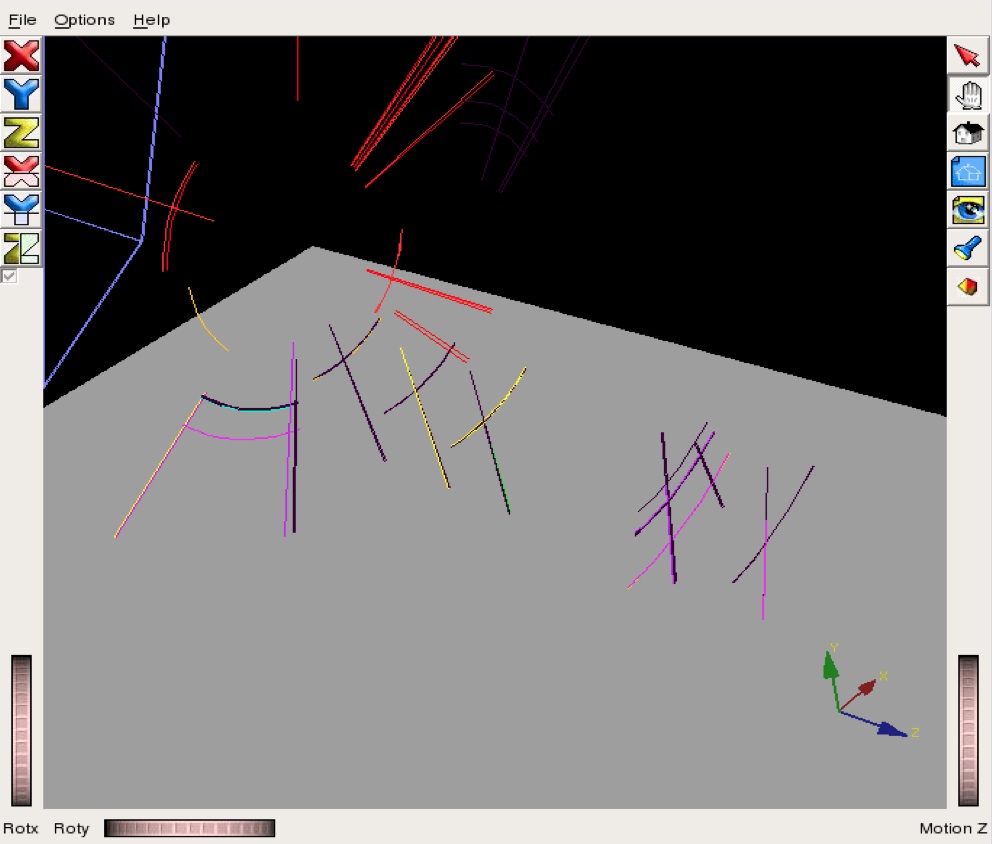
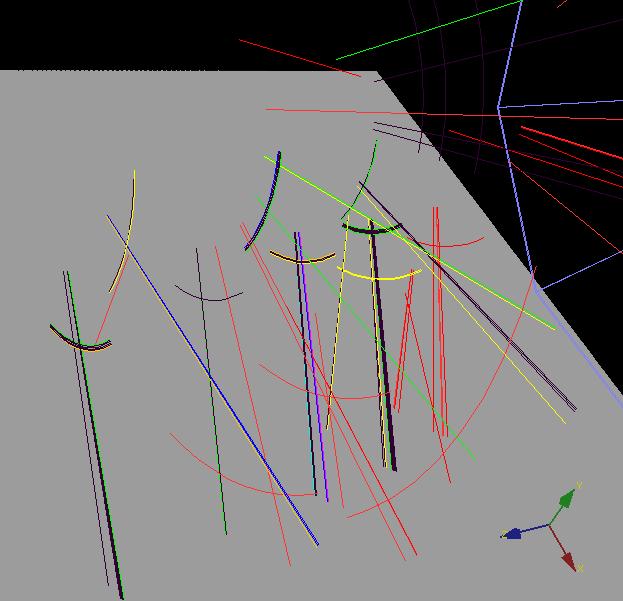
The next three figures show a perspective drawing of the FGT hit strips in the detector. The inner bound of the TPC is drawn. And the East endcap is visable in the background.
Perspective views:
Strip color toggled off:
Mask for hits in high time bins disabled:
Here's a screen shot with the event display from a data collection run. A track is evident in pairs of clusters in disks 4 and 5.
Low angle track hits 5 of 6 disks.
Another Low Angle track through 5 disks.
Two Tracks:
- pnord's blog
- Login or register to post comments