Dihadron azimuthal correlation asymmetry and unpolarized cross section: Paper Proposal Draft
Target Journal: Physics Review D
Title:
Measurement of Transverse Spin Dependent $\pi^+\pi^-$ Azimuthal Correlation Asymmetry in $p^\uparrow p$ and $\pi^+\pi^-$ Cross-Section in $pp$ Collisions at $\sqrt{s} = 200$ GeV at STAR
Abstract:
Dihadron Channel and Azimuthal Correlation Asymmetry (AUT)
Dihadron channel: pî + p -> π+π- + X (for asymmetry), p+ p -> π+π- + X (for cross-section)
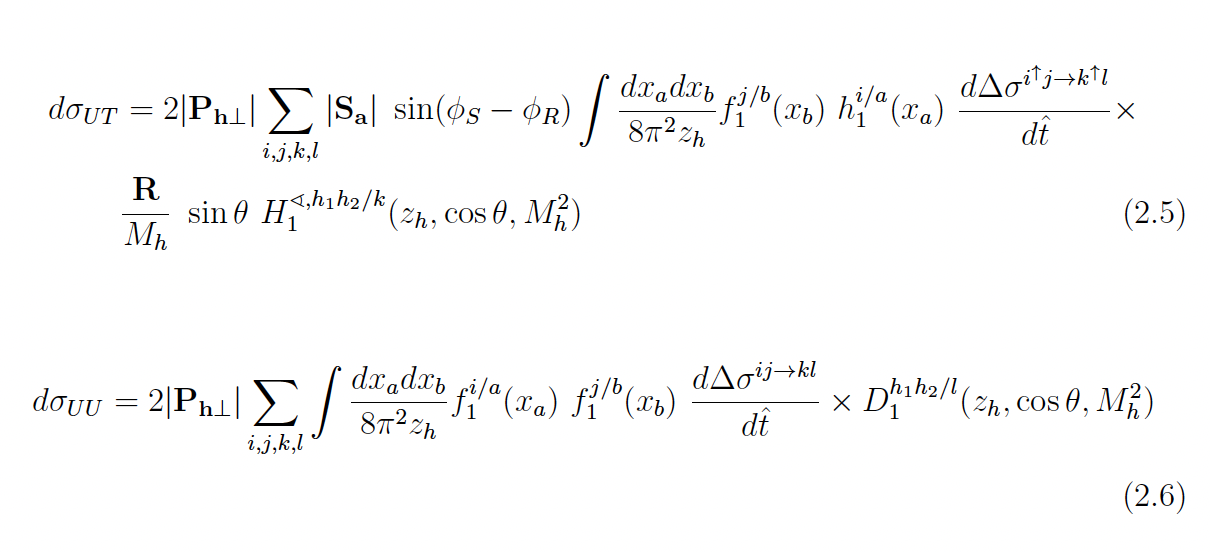
Polarized (dσUT) and unpolarized (dσUU) dihadron cross-sections:
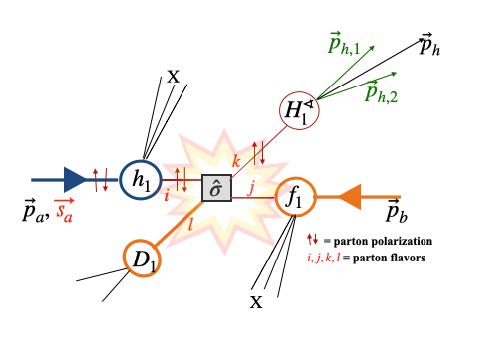
Dihadron azimuthal correlation asymmetry is sensitive to the product of transversity (h1)and IFF (H1):
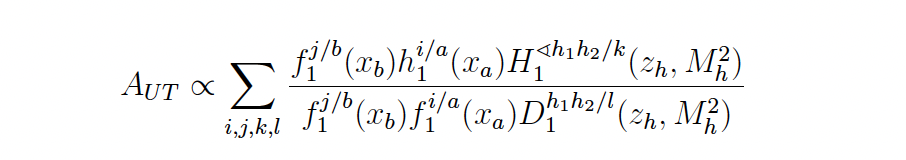
of uncertainty in the transversity. Specifically, D1 for gluons is unconstrained. Unpolarized cross-section
measurement (dσUU) from the pp collision provide access to D1 sensitive to the both quark and gluons.
Thus, the dσUU measurement from pp is crucial constraining transversity.
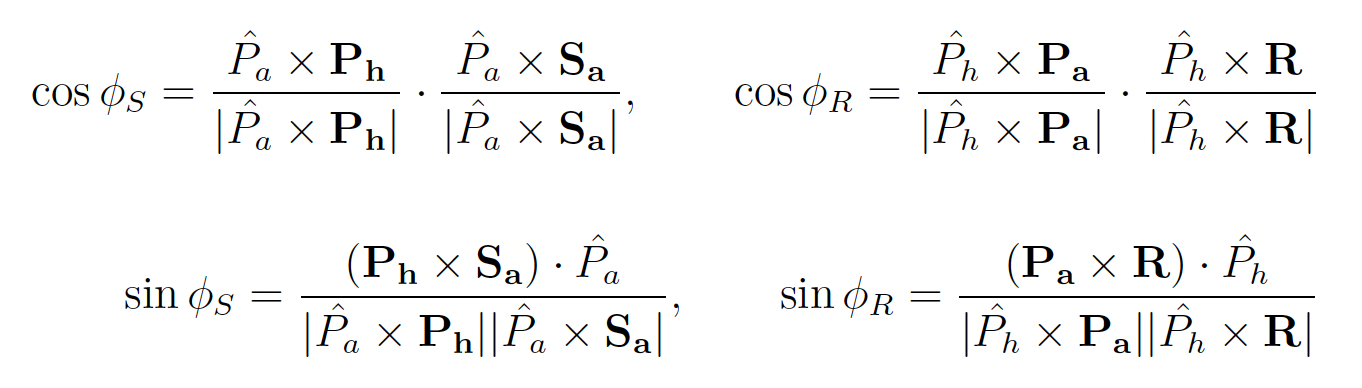
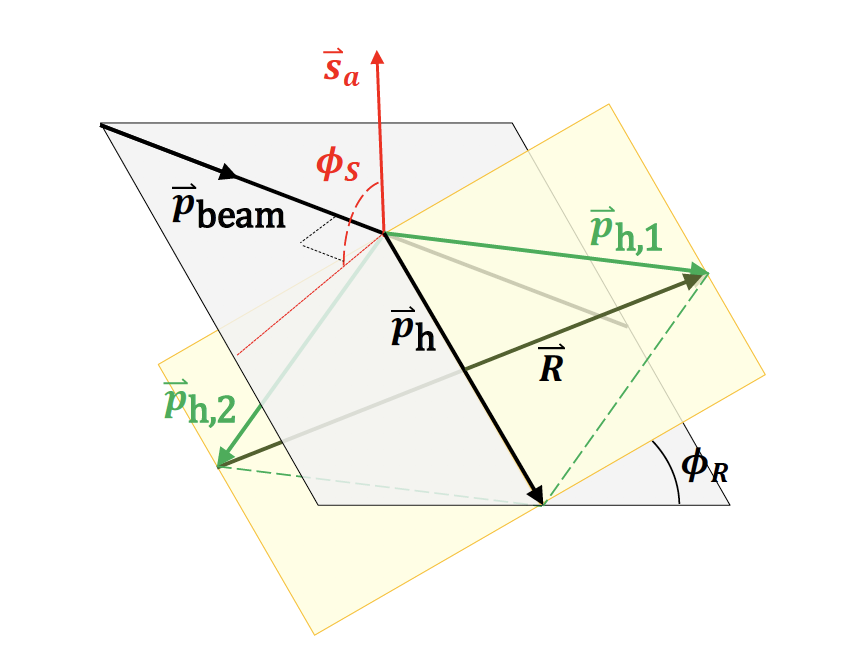
AUT Extraction: Cross-Ratio Formula
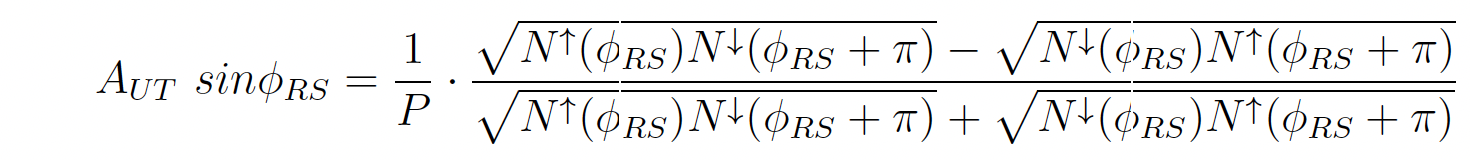
where, N represents the number of π+π- pairs when the spin is up or down.
Dataset:
| IFF Asymmetry | Cross-Section | |
| Run Year | 2015 | 2015 |
| Center-of-mass energy | 200 GeV | 200 GeV |
| Polarization | transverse | transverse |
| Trigger Set | production_pp200trans_2015 | pp200_production_2012 |
| Production Library | SL16d | SL12d |
| Integrated Luminosity | ~ 52 pb-1 | ~ 14 pb-1 |
| Triggers | JP1, JP2 | JP0, JP1, JP2 |
Dipion selection:
| IFF Asymmetry | Cross-Section | |
| Z-Vertex (Vz) | |Vz|<60 | |Vz|<60 |
| Z-Vertex Ranking (Vz,rank) | Vz,rank > 1e6 | Vz,rank > 1e6 |
| Track eta | |eta|<1 | |eta|<1 |
| Track pT | 15 > pT > 1.5 GeV/c | 15 > pT > 0.5 GeV/c |
| Track dca | dca < 1.0, ( pT > 1.5) | dca < 2.0, if pT < 0.5 dca <(2.5 - pT), if 0.5<pT <1.5 dca < 1.0, if pT >= 1.5 |
| Track nHItsFit | nHitsFit > 15 | nHitsFit >15 |
| Track nHitsFit/nHitsFitPoss (fitRatio) | fitRatio > 0.51 | fitRatio > 0.51 |
| Pion Selection | -1<nSigmaPion<2 | -1<nSigmaPion<2 |
| π+π- Cone | cone < 0.7 | 0.02 < cone < 0.7 |
| π+π- Minv |
0.27 < Minv < 4 |
0.27 < Minv < 4 |
| π+π- eta (n) | |n|<1 | |n|<1 |
| π+π- pT | 2.5< pT < 15.0 | 1.0< pT < 15.0 |
Results:
AUT extracted in Minv, pT, and eta bins. The eta direction is a surrogate of x, with forward eta region probes higher x, and vice-versa.
Dipion azimuthal correlation asymmetries:
1. AUT vs Minv, multi-binning in pT and eta
.png)
Figure 1: AUT vs Minv in forward (eta > 0 )(red) and backward (eta < 0) (blue) pseudorapidity
regions in five pT bins. The average pT increases from left to right and from top to bottom, the value
of which is shown on the top right corner of each panel. Higher asymmetries are observed in forward
region and the signals are more prominent in higher pT bins. Forward asymmetries peak around
Minv ≈ 0.8 GeV/c2, close to the rho-meson mass (Minv ≈ 0.775 GeV/c2 ). Backward asymmetries are
relatively small, which are mostly from unpolarized beam. Systematic uncertainty includes the particle
identification and trigger bias combined.
2. AUT vs Eta, integrated pT and Minv
.png)
Figure 2: AUT vs Eta integrated over Minv and pT (top panel). < x >, average of x1 and x2, and < z >,
average of z1 and z2, in the same eta bins from simulation (bottom panel). x increases from 0.1 to 0.22
from negative to positive eta regions. z shows slight dependence in forward and backward pseudorapidity
region separately, but overall, it is averaged out to be ≈ 0.46. Forward asymmetries are large, where we
have access to higher x. Small backward asymmetries, which is mainly from the unpolarized beam, corresponds
to the lower x region. Systematic uncertainty includes the particle identification and trigger bias combined.
3. AUT vs pT multi-binning in Minv and eta
.png)
Figure 3: AUT vs pT in forward (eta > 0 )(red) and backward (eta < 0) (blue) regions in five Minv bins. The average Minv
increases from left to right and from top to bottom, the value of which is shown on the top left corner of each panel.
Higher asymmetries are observed in forward region and the signals are more prominent in Minv bins close to
Minv ≈ 0.775 GeV/c2. Backward asymmetries are small, but non-zero, at higher pT, which is mostly from the unpolarized
beam. Systematic uncertainty includes particle identification and trigger bias combined.
4. AUT vs Minv, integrated pT (Below figure will be updated as a two panel plot, including eta < 0 result in the bottom panel)
.png)
Figure 4: (Top Panel) STAR AUT vs Minv in eta > 0 region integrated over pT, compared with the theory at √s = 200 GeV.
The uncertainty band of the theory curve is obtained with the bootstrap method based on 600 replicas at 90%
confidence level (Radici et. al.).
Unpolarized dipion cross-section
.png)
Figure 5: Top panel: the measured (shown in red), PYTHIA (shown in black), and JAM (shown in blue) cross-sections.
Bottom panel: total relative systematic error (green band), statistical error (red band), shown on the left axis , and
relative difference of the PYTHIA and JAM DiFF prediction to the measured cross-section (Ratio) is shown in the right axis.
Other relevant figures:
==>> Reference to this figure (originally drawn by Anslem Vossen) or draw new
Figure 6: DiFF kinematics
==>> Reference Plot ( Alternative figure would be the x distribution from the simulation, probably in
asymmetry binning . For example, x distribution in Mass, pT, and Eta bins. x-distribution
with varying cone.)
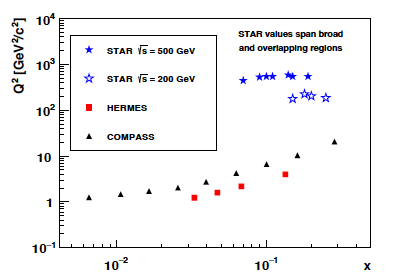
Figure 7: (Figure from STAR 500 GeV paper) Similar figure showing STAR kinematic coverage
==>> In addition to this, process dependent distribution from the Pythia in Mass
bins would be more impactful.
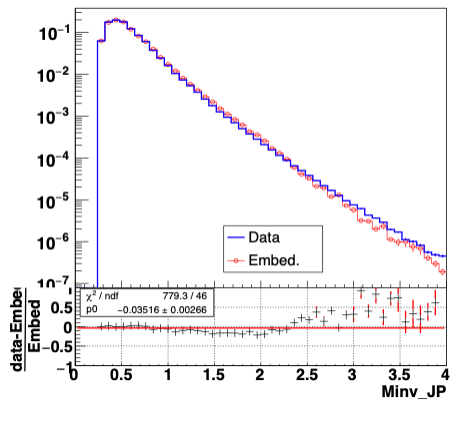
Figure 8: Data and embedding comparison for π^+π^- invariant mass (this is important for
the cross section part as this measurement heavily relies on the embedding)
(figure 9/10 not ready!)
Figure 9/10: PID studies for IFF and cross-section (data-driven approach). There will be two
figures, one for each part, as the origin of the systematic uncertainties are different in the IFF
and cross section analysis.
----------------------------------------------------
Further analysis:
----------------------------------------------------
IFF Analysis
- Particle Identification (PID) and Systematic uncertainty associated with the PID
PID with the dE/dx calibration method (similar as in the Collins analysis).
PID systematic uncertainty is expected to be small.
- Systematic uncertainty from the background (underlying events) contribution
(Study found that the contribution is small (< 1%) )
IFF Systematic Checks:
- Consistency check between Blue and Yellow beam asymmetry (tested)
- Cosine modulation should result zero(diluted) asymmetry
- Random spin ordering should result in zero(diluted) asymmetry
- Randomizing vector R should result in diluted asymmetry (tested)
Unpolarized Cross-Section Measurement
- Data-driven PID correction (same as in the IFF analysis)
- Systematic uncertainty revisit
----------------------------------------------------
----------------------------------------------------
Conclusion:
1. IFF asymmetries are statistically precise, which are in good agreement with previous STAR
measurements and the model calculation.
2. The unpolarized dipion cross section result, which is in good agreement with the JAM prediction,
will constrain the unpolarized fragmentation functions.
3. These high precision measurements will provide a foundation for the transversity extraction with
greater precision than previously possible.
4. These measurements will also tests universality between different processes: SIDIS, e^+e^-, and pp.
Relevant presentations and links
Please refer to the preliminary request page.
Paper proposal presentation: Link
Cone Optimization Studies
Analysis Note
Please refer to the analysis note for the analysis details in the attachment: Analysis Note
Code location
IFF Code Location
Cross Section Code Location
- pokhrel's blog
- Login or register to post comments