IFF Preliminary Results
Transverse Spin Dependent Azimuthal Correlations of Charged Pion Pairs in Polarized pp Collisions at √s = 200 GeV
(Preliminary Results)
.png)
Figure 1: AUT vs Minv in forward (eta > 0 )(red) and backward (eta < 0) (blue) pseudorapidity regions in five pT bins. The average pT increases from left to right and from top to bottom, the value of which is shown on the top right corner of each panel. Higher asymmetries are observed in forward region and the signals are more prominent in higher pT bins. Forward asymmetries peak around Minv ≈ 0.8 GeV/c2, close to the rho-meson mass (Minv ≈ 0.775 GeV/c2 ). Backward asymmetries are relatively small, which are mostly from unpolarized beam. Systematic uncertainty includes the particle identification and trigger bias combined.
.png)
Figure 2: AUT vs pT in forward (eta > 0 )(red) and backward (eta < 0) (blue) regions in five Minv bins. The average Minv increases from left to right and from top to bottom, the value of which is shown on the top left corner of each panel. Higher asymmetries are observed in forward region and the signals are more prominent in Minv bins close to Minv ≈ 0.775 GeV/c2. Backward asymmetries are small, but non-zero, at higher pT, which is mostly from the unpolarized beam. Systematic uncertainty includes particle identification and trigger bias combined.
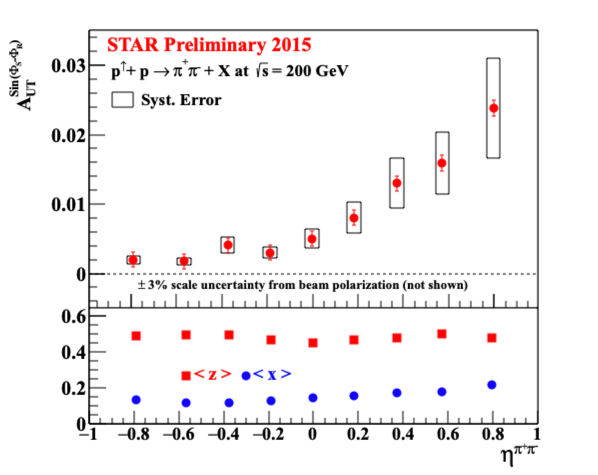
Figure 3: AUT vs Eta integrated over Minv and pT (top panel). < x >, average of x1 and x2, and < z >, average of z1 and z2, in the same eta bins from simulation (bottom panel). x increases from 0.1 to 0.22 from negative to positive eta regions. z shows slight dependence in forward and backward pseudorapidity region separately, but overall, it is averaged out to be ≈ 0.46. Forward asymmetries are large, where we have access to higher x. Small backward asymmetries, which is mainly from the unpolarized beam, corresponds to the lower x region. Systematic uncertainty includes the particle identification and trigger bias combined.
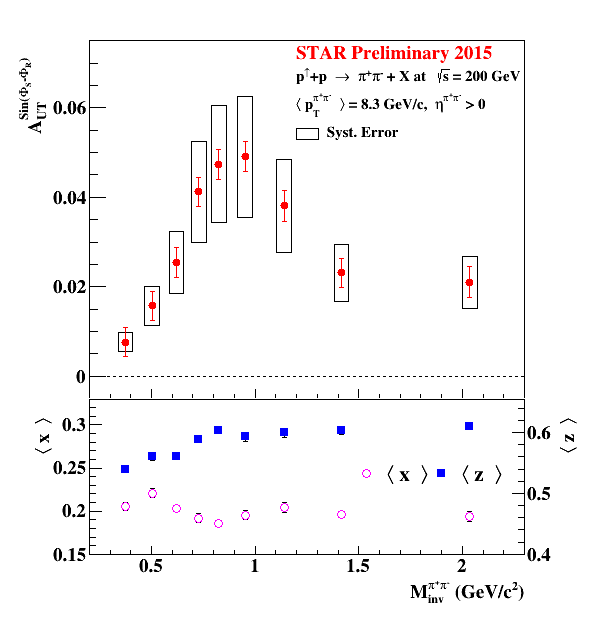
Figure 4: AUT vs Minv in highest pT bin (top panel) and < x > and < z > in corresponding Minv bins (bottom panel). Although slight fluctuations, x is consistent to ≈ 0.2, over all Minv bins, however, z increases with the increase in Minv. This shows strong correlation between AUT and z.
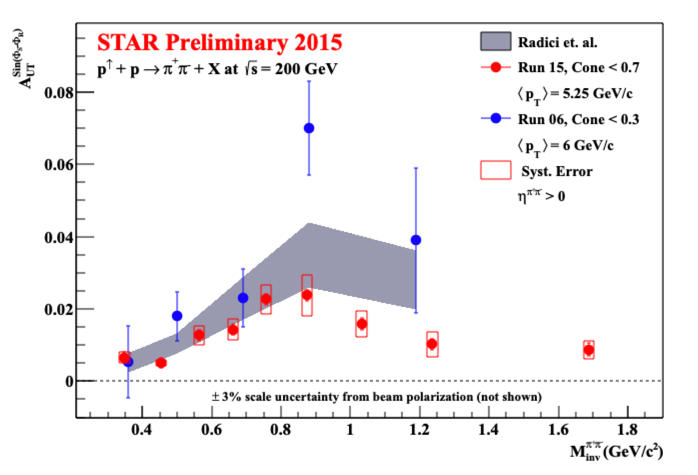
Figure 5: STAR AUT vs Minv in eta > 0 region integrated over pT, compared with the theory at √s = 200 GeV. The uncertainty band of the theory curve is obtained with the bootstrap method based on 600 replicas at 90% confidence level (Radici et. al.).
Watch DIS Presentation:
www.youtube.com/watch
Updates:
12/20/2022
1. Analysis note updated. Data table includes the bin ranges as well.
updated note: IFFPrelmNote_Updated.pdf
- pokhrel's blog
- Login or register to post comments