BES-II Figure
Hi All,
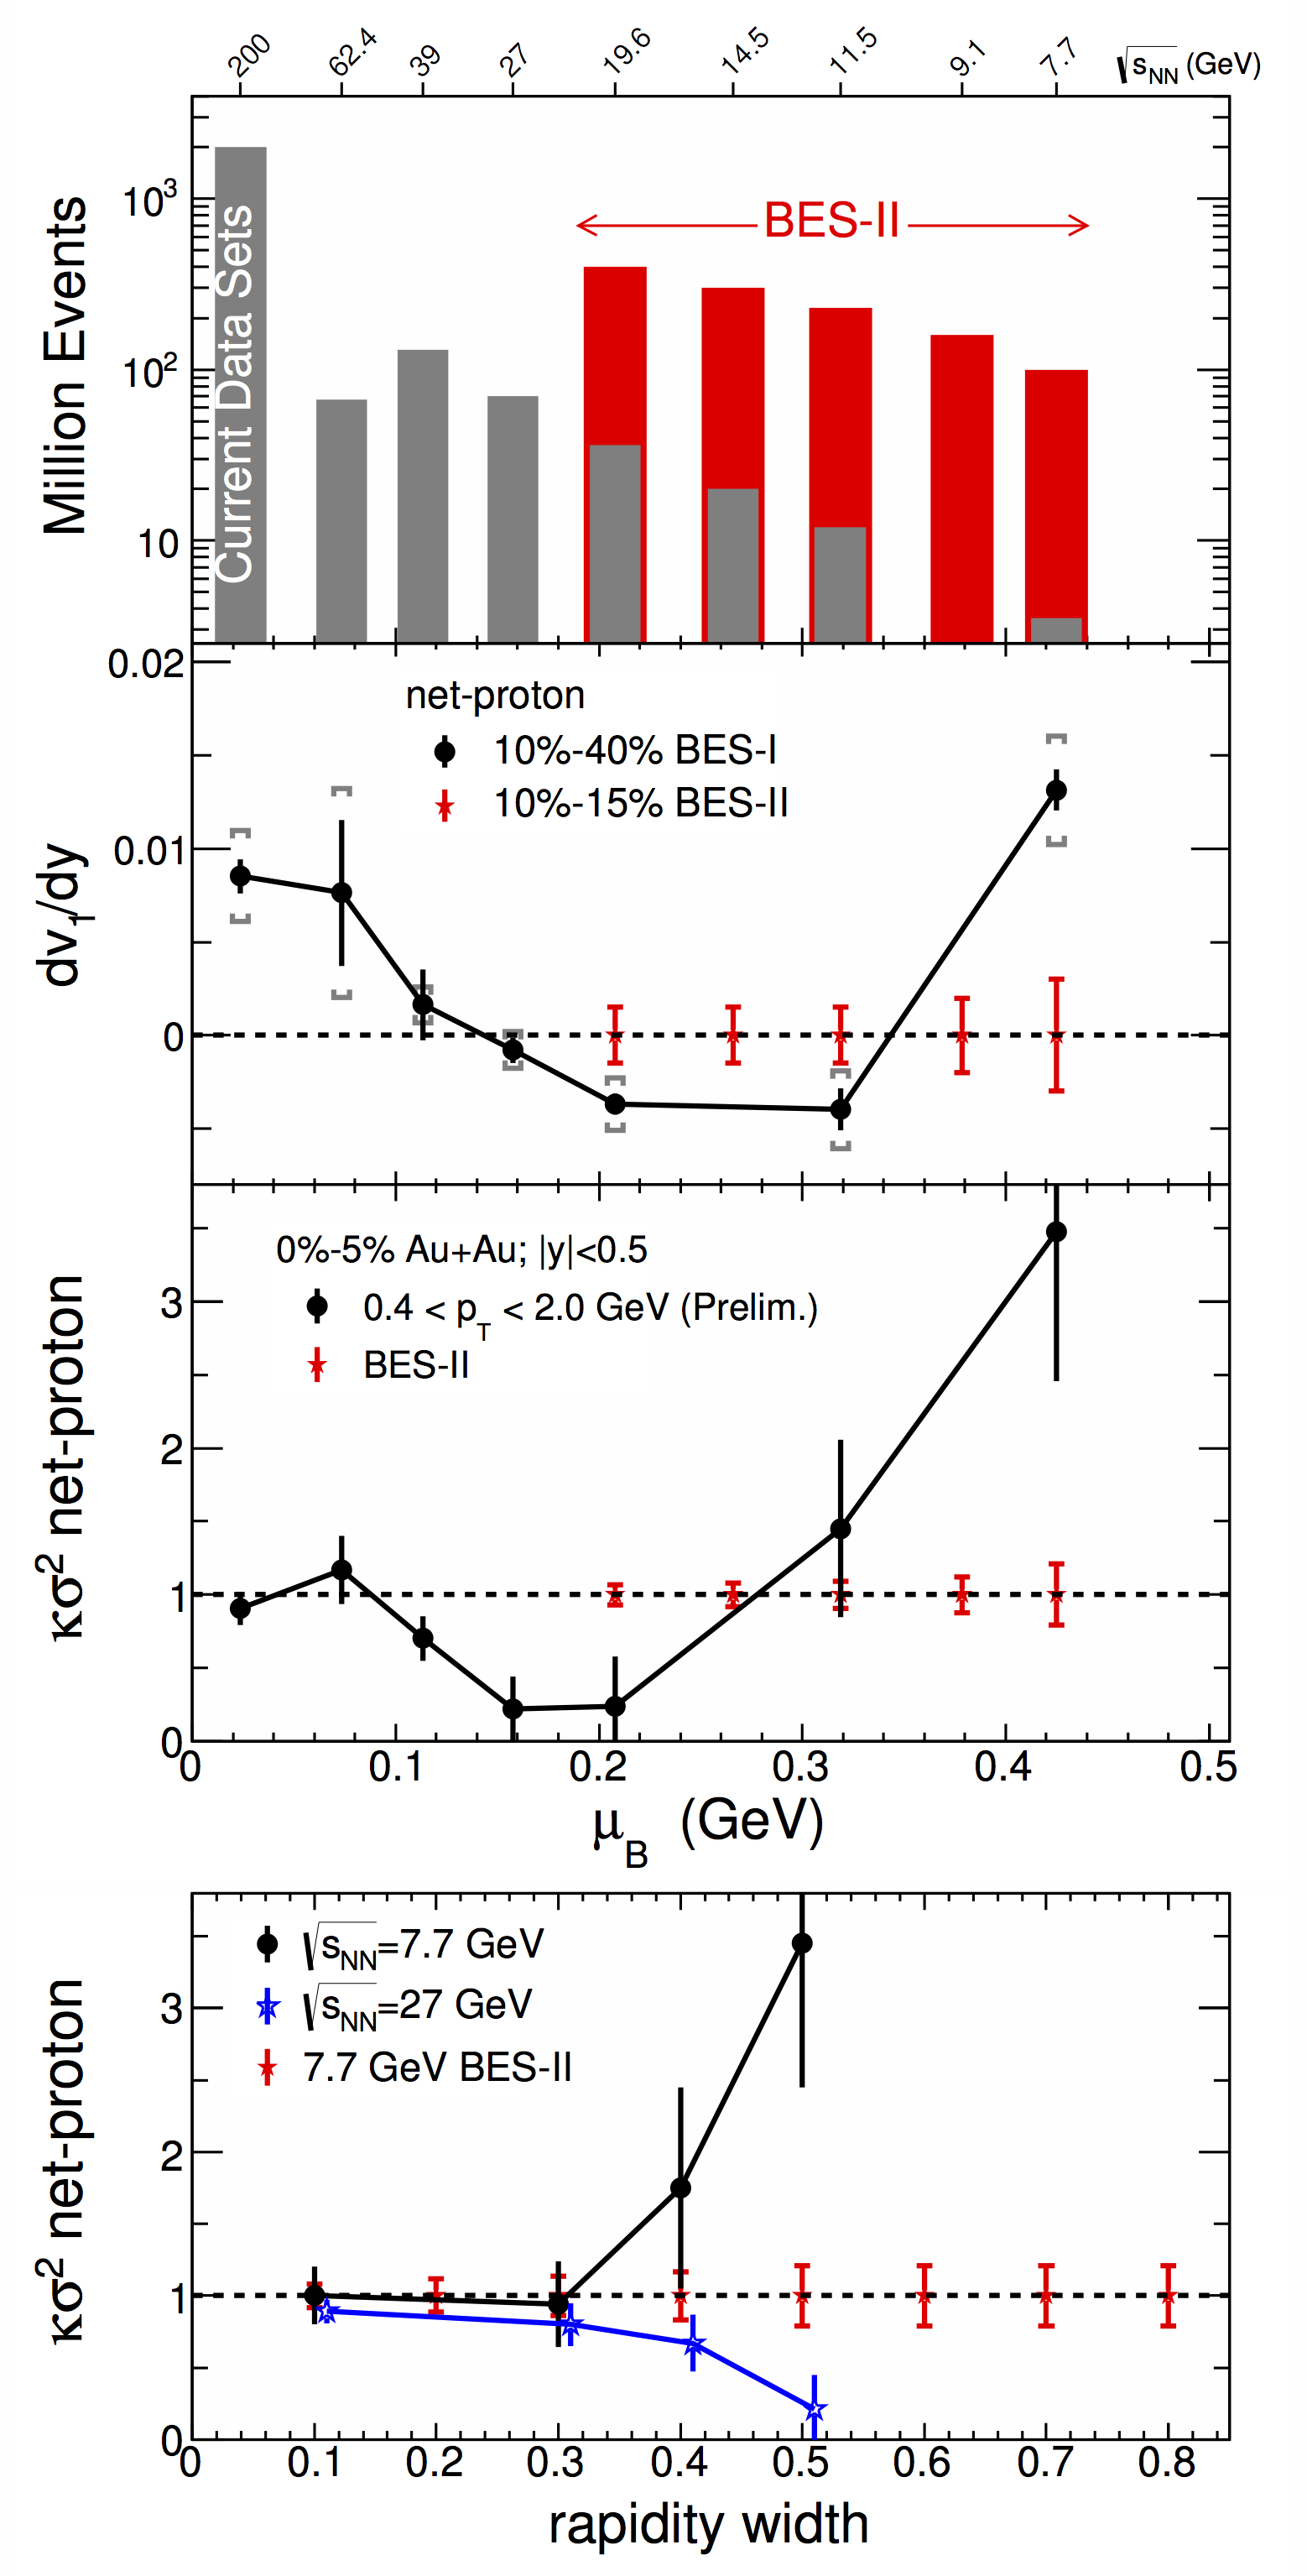
I wanted to discuss a figure I recently put together for the BES-II section of the Long Range Plan report. I used information from the STAR BES-II white paper and from Xiaofeng's CPOD talk. Xioafeng also helped me with the error bar estimates. The figure is put together to illustrate the improvements that will be brought by BES-II and the iTPC upgrade. In order to emphasize the importance of the iTPC upgrade, I've added a panel that shows the evolution of kappa*sigma^2 with rapidity width (|y|<rapdity width). The figure shows that the interesting trends in the beam energy dependence of kappa*sigma^2 appear for the largest rapidity widths. The rapidity width dependence of the measurement must be understood if we hope to extract physics from the measurements (like comparing to lattice or drawing conclusions about the nature of the phase diagram). I think we should emphasize that point because it's true, important, and it also points to the clear advantage of extending the rapidity coverage of the STAR TPC. The iTPC upgrade will represent a large improvement in our ability to map out this dependence. Extending that coverage increases the chance that we will be able to understand the data at the level necessary to make a discovery in BES-II. The iTPC is not just nice to have but is likely that it will be crucial to drawing the most important conclusions we hope to draw from the BES-II program.
The figure is attached as a pdf or eps:
- psoren's blog
- Login or register to post comments