absolute cross section notes 5
Here is the procedure I'm using to compute the absolute cross section:
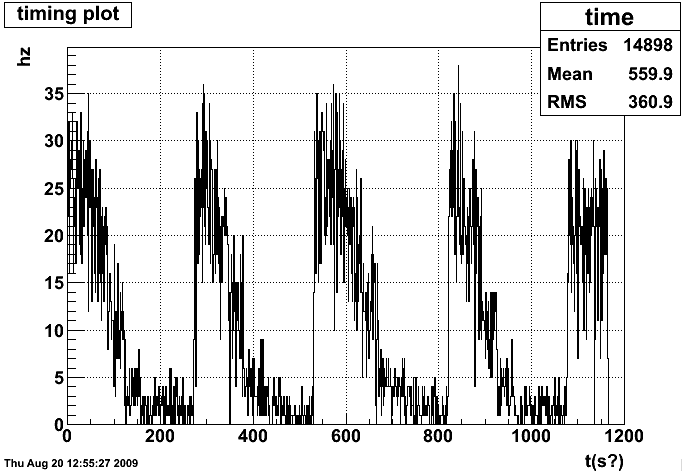
We start with the muDsts taken during the vernier scan, reading through them to create a histogram of events per second for our chosen trigger (here, BHT3)
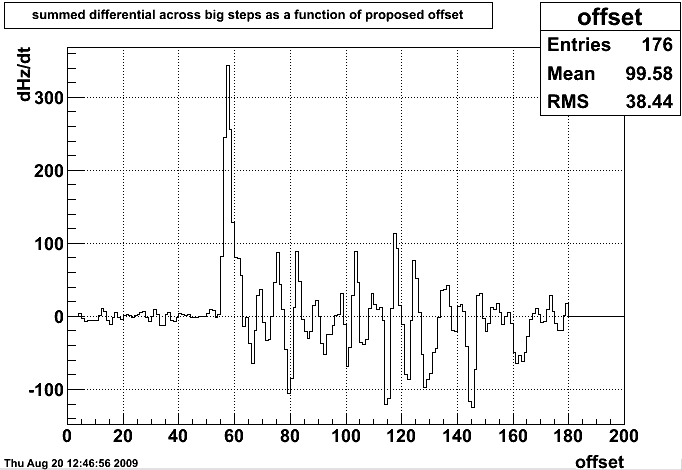
Angelika has provided a list of timestamps corresponding to the completion of each step in ther vernier scan. We do not know the relationship between system time on that machine, and relative time into our data-taking, but we can match them by taking the relative timestamps (first one defined to be t=0) and applying an offset to them. At each choice of the offset, we compute the change in rate across each of the large steps (when the vernier scan returns to dx=dy=0). The largest of these should be the correct offset, with other peaks corresponding to each shift in position.
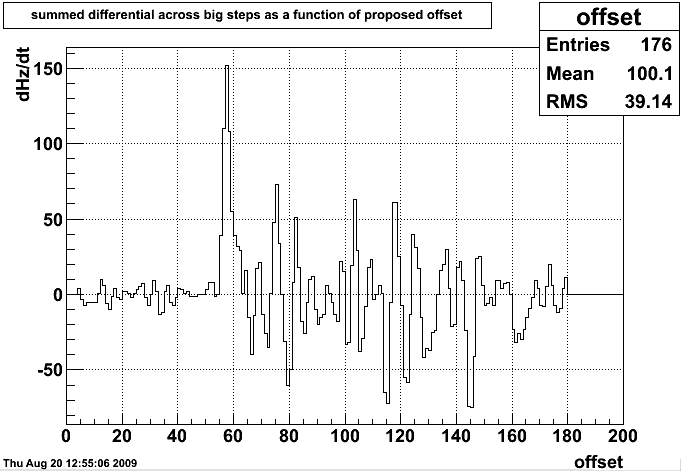
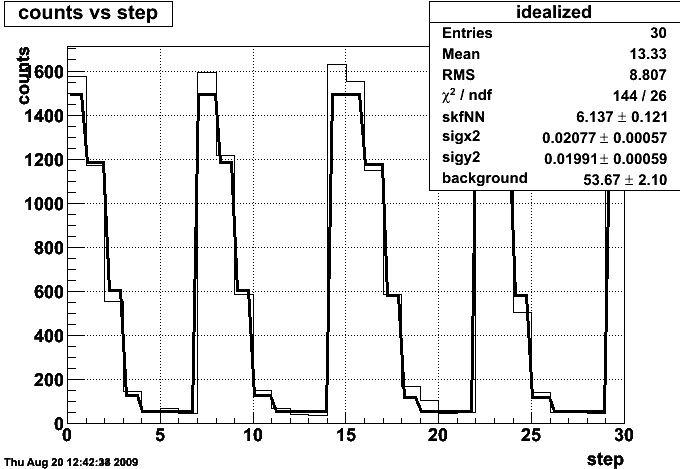
We can see a single large peak, and a lot of 'ringing', but we can be confident that we have the correct offset. We then integrate over a reasonable period before each timestamp to get the number of events in that position bin. To avoid integrating at times when the beams may be moving, we remove the first and last five seconds of each bin. The result is a cleaned-up version of the first plot:
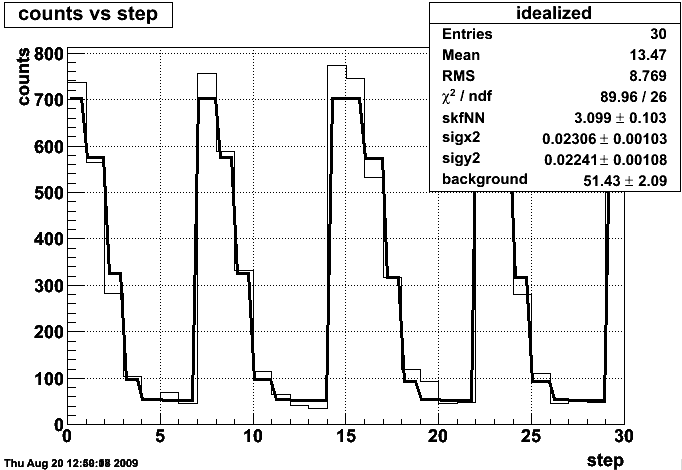
The fit line here is a little convoluted. We have a functional form for the data rate coming from the overlap of two offset gaussians as a function of their relative position, so we can use the x and y positions as a function of time to get the data rate as a function of time. Here, I have added a possible flat background as well. The part we care about is the variable skfNN, which is sigma_BHT3*number of bunches*frequency of revolution*number of ions in blue*number of ions in yellow.
The problem is that we do not expect there to be such a high background rate. A quick calculation suggests that the hottest towers don't have a high enough rate to account for this. I am looking into possible eta and phi dependence of the BHT3 events in the low-count regions.
For comparison, I also followed the same procedure for all triggers (BHT3 || minbias || other triggers in the vernier scan - online.star.bnl.gov is down right now and I can't get the list):
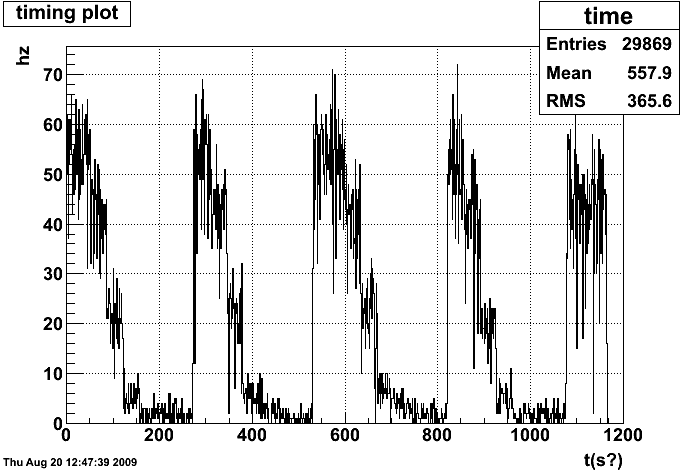
Notice in the plot above we can wee the different steps more clearly than for just BHT3.
and here notice that the correct offset hasn't moved at all. The 'ringing' is smaller, relatively, as well, which we'd expect given how much clearer the bins are in the previous plot.
And here's the big plot again. Note that the background hasn't scaled up, meaning most of it is associated with BHT3 already. I'm concerned that the widths of the gaussians seems to have changed, and will look into this as well.
- rcorliss's blog
- Login or register to post comments