- rcorliss's home page
- Posts
- 2013
- January (1)
- 2012
- 2011
- 2010
- December (1)
- October (2)
- September (2)
- August (2)
- June (2)
- May (3)
- April (3)
- March (5)
- February (2)
- January (8)
- 2009
- December (5)
- November (1)
- October (7)
- September (10)
- August (4)
- July (3)
- May (1)
- February (1)
- January (1)
- 2008
- 2007
- My blog
- Post new blog entry
- All blogs
Looking at non-gaussianity in the vernier scan
The basic issue is that the vernier scan fit doesn't seem to agree with the rough calculation that comes from using the rates from the trigger details page. The rough calculation produces a value ~400nb
This brief update shows how sensitive the vernier scan fit can be.
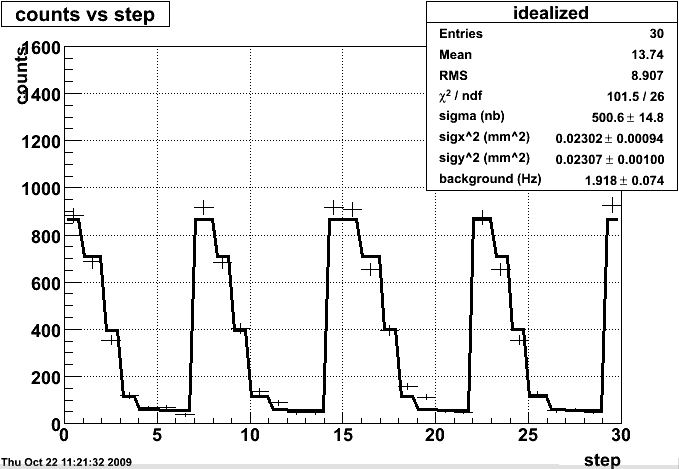
Here's the fit (for run 10097097) with no constraints:

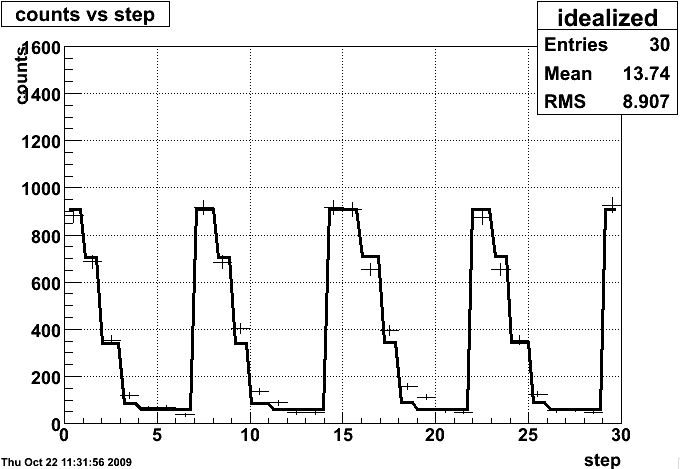
...and here it is when I manually set the cross section to 418nb, and tweak the other values to make it look good:

xs=418
sigx2=.0182
sigy2=.0184
background=1.95
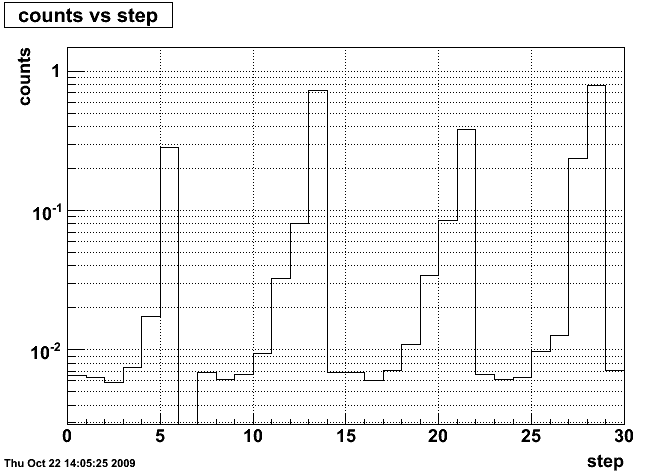
I zero-suppressed the plot above by subtracting off bin 6 from every bin (bin 6 is the least populous), then looked at the ratio of this to the ZDC scaler data Angelika provided. If they truly had very similar widths (which is what the unconstrained fit reports), then their ratio should be constant across all bins. Instead, we get the following:

Bin 6 is 0, as expected, but for teh rest, we see a sharp ramp up after the first ~3 bins of each of the four directions. These regions, for the BHT3 trigger, are not gaussian+constant. This could imply that there is more background (linear with beam impact paremeter?), or more signal (second gaussian with larger width and smaller height?), but neither of these ideas seems particularly motivated by physical concerns.
Trying to characterize or at least deal with this nongaussianity in a consistent fashion seems to be the next task.
- rcorliss's blog
- Login or register to post comments
