- rcorliss's home page
- Posts
- 2013
- January (1)
- 2012
- 2011
- 2010
- December (1)
- October (2)
- September (2)
- August (2)
- June (2)
- May (3)
- April (3)
- March (5)
- February (2)
- January (8)
- 2009
- December (5)
- November (1)
- October (7)
- September (10)
- August (4)
- July (3)
- May (1)
- February (1)
- January (1)
- 2008
- 2007
- My blog
- Post new blog entry
- All blogs
eta dependence of non-gaussianity
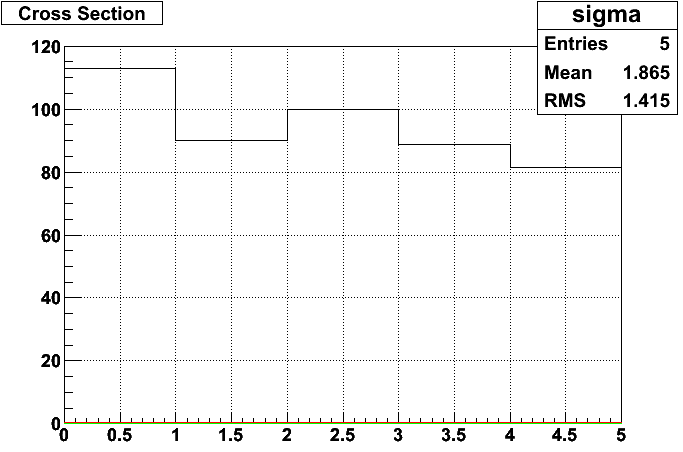
I divided the vernier scan data into five segments by eta rings, 0 corresponding to the highest abs(eta), 4 corresponding to the lowest. Each has two rings of trigger patches - one from east and one from west.
In the plots below, black is the cross section from the vernier scan fit, blue and green are the x and y widths from the fit, and red is the background rate from the fit. The outer eta rings do seem to have higher background, and a higher cross section that may be related to that feature, but the widths, which I'd expected to change if there were different non-gaussian contributions as a function of eta.

.png)
I've heard back from Angelika regarding her analysis of the data I sent her - she sees the same nongaussian feature, and has been trying various more complicated models to attempt to get a good fit.
- rcorliss's blog
- Login or register to post comments
