partial barrel vernier scan and task list
In the past I've shown plots showing a fairly large background in the BHT3 event rate, and at the last meeting I showed how clean and clear the vernier scan for the BBC was. The hope was that by removing the noisier trigger patches from the BHT3 calculation, the background rate could be eliminated (and localized to certain parts of the detector, which would help figure out where it's coming from). This doesn't seem to have played out.
The first step was to figure out which patches fired the BHT3 trigger for each event. This was done by looking at the L0 high tower values, and incrementing each patch for which the ADC value was >30 (the trigger threshold was 31). There may be some slight overcounting relative to the number of events, if more than one patch simultaneously fulfilled the trigger, but this effect is hopefully small.
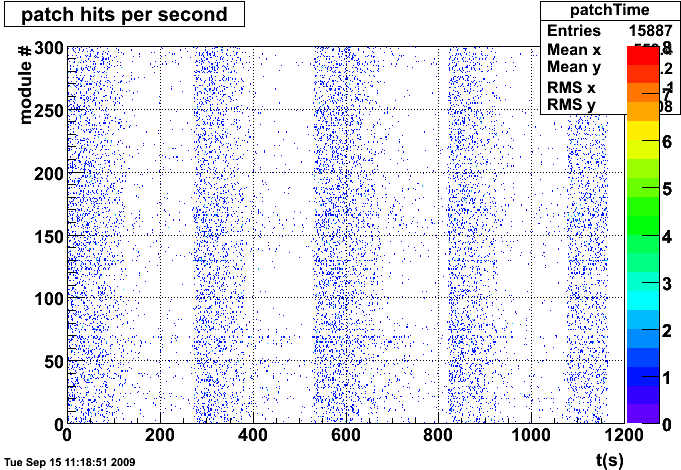
Figure 1. Count rate of each High Tower Trigger Patch as a function of time. We can see the familiar vernier scan pattern in each row. The plots I've shown previously should be roughly the sum of all rows, with a small overcounting (15887 total entries here vs 14898 in a 1-dimensional plot).
The statistics are fairly low when we have to divide into 300 patches, so I divide the above plot into two regions, a low-count (large displacement) region and a high-count (small displacement) region. The low regions are [150,260],[410,510],[700,800],[950,1050], with all others counting as high.
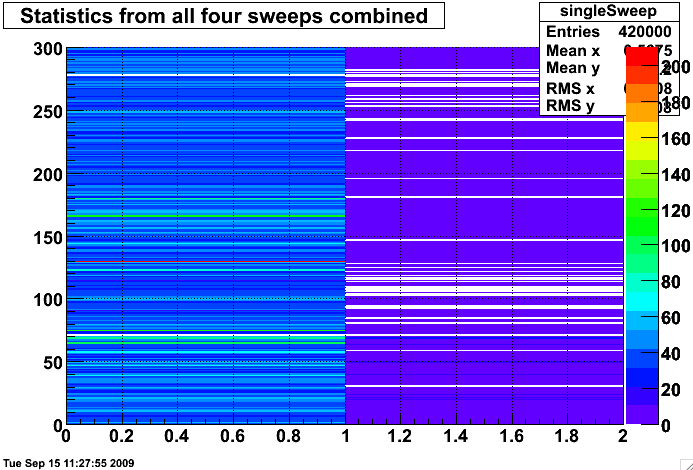
Figure 2. Comparison of High- and Low-Rate regions for each trigger patch. The high rate values are on the left and the low the right, with the vertical axis still showing trigger patch number. The most egregious offenders are the lines where the right side has something other than the lowest purple in it.
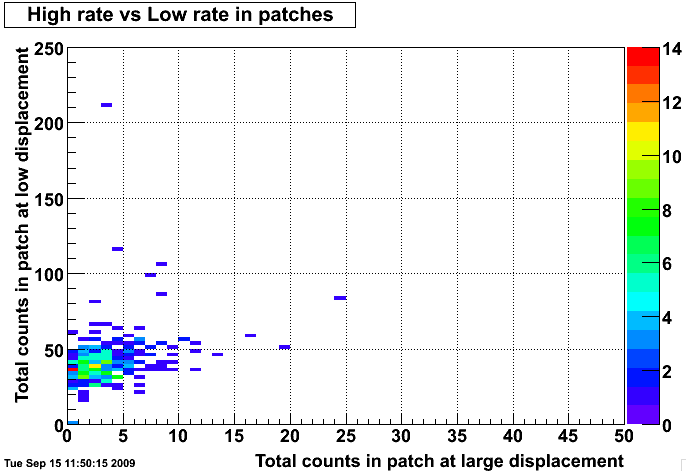
Figure 3. Small-displacement vs Large-displacement counts for the trigger patches. This is a rearrangement of fig. 2. The patches most responsible for the high background rate are those farthest to the right.
There are two approaches on how best to tag patches that may be hot or otherwise responding to backgrounds. The first would be to look at the ratio of the rate in low and high and cut the outlying values. The second is to simply look at the values in the low-rate region, and cut when they get too high. This is what I did.
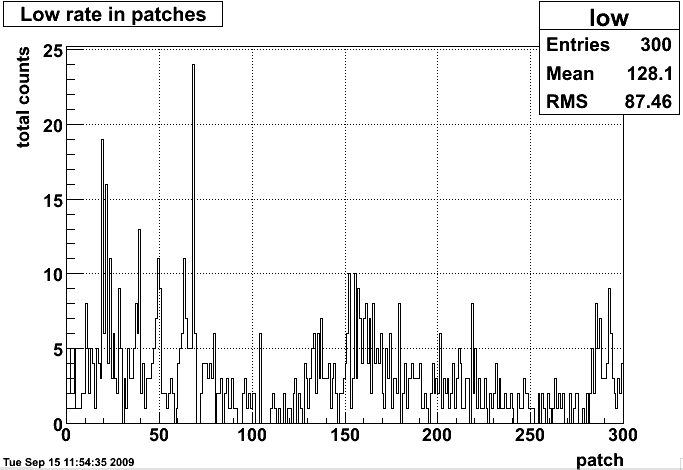
Figure 4. Total counts in the summed low regions, shown vs patch. The sources of background should be most visible here.
From fig. 4 I kept only the regions [80,125], and [200,280]. This results in a new rate histogram (fig. 5) which can be compared to the original (fig 6)
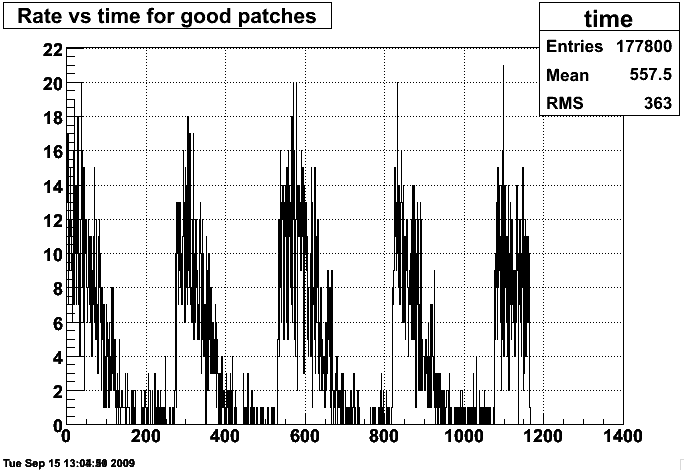
Figure 5. The summed of the rates from all high tower trigger patches in the regions selected as 'good'. The vernier scan structure can still be clearly seen.
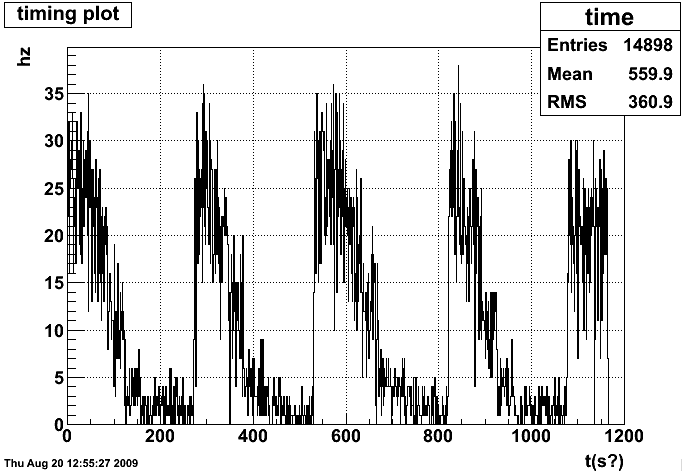
Figure 6. The BHT3 rate for a function of time including all trigger patches.
The new trigger rate can be fed through the vernier scan code, and once again produces a counts vs step plot with a fit.
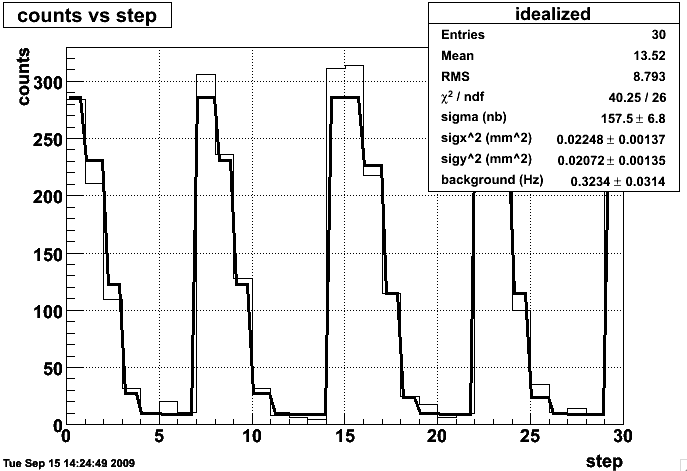
Figure 7. The fit to the baserate from figure 5. The gross discrepency between the cross section of this and the following figure is a result of a small change to the code (two factors of 1/N_bunches). The value here is more recent.
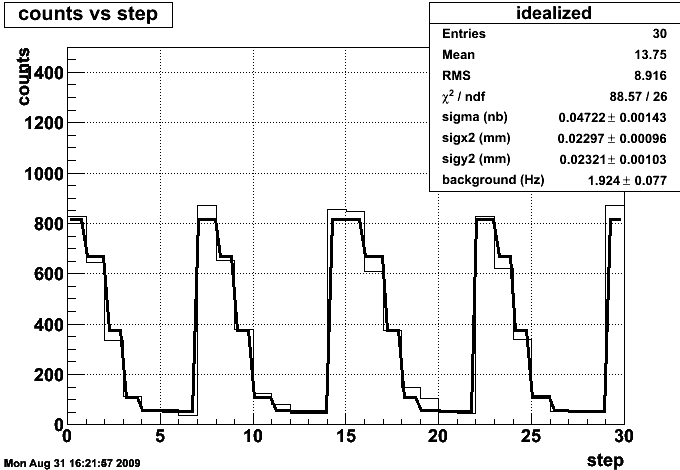
Figure 8. The vernier scan fit for all the BHT3 events from 10097097. Note that we have reduced the background more than proportionally to the number of events we've lost (factor of two more background removed than events).
It's heartening to see that the widths (sigx2 and sigy2) have not moved dramatically between the two fits.
I've also found the last large discrepency between my calculations and reasonable values - The number of ions that appears in the calculation should be the number of ions per bunch and not the number of ions per beam. This results in two factors of ~100. Along with a prescale value that was only listed in the Trigger Details page (another 100), I was able to get the BBC cross section up to a reasonable order of magnitude.
There is still some concern that the BBC saturation effect is not enough to cause the discrepency between ~15mb seen during the vernier scan and ~26mb seen during the low luminosity run. I'll add another post on this topic later in the week.
- rcorliss's blog
- Login or register to post comments