Position of BHT3 background rates (in eta phi)
The question was raised, whether there was a particular region in eta-phi that has background. The following two plots show the responses of each trigger patch integrated over the high-rate region (fig 1) and the low-rate region (fig 2), with the regions defined in my previous blog post. The mapping from patch to physical location was provided by Pibero by way of Jan. The code can be found at http://drupal.star.bnl.gov/STAR/blog-entry/balewski/2008/jul/30/btow-tp-mapping-2d-pibero.
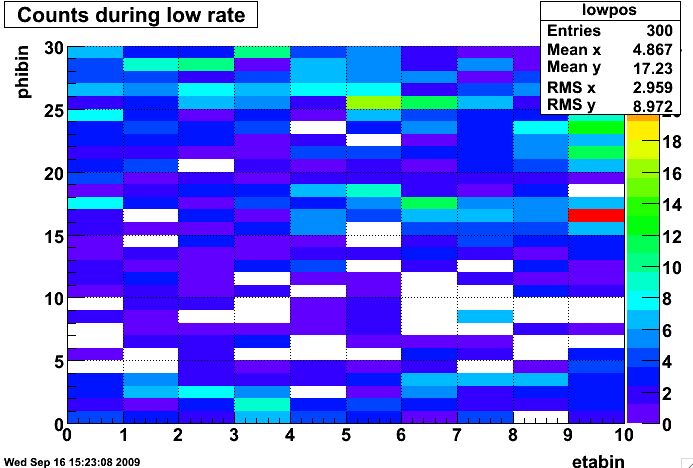
Figure 1. Trigger rate by patch, integrated over the time ranges where the two beams have a large offset. The patches are arranged in eta-phi space, with etabin=0 corresponding to eta=-1. There seems to be a hot region at phibin ~ 25-30, and a matching cold region at ~ 5-10.
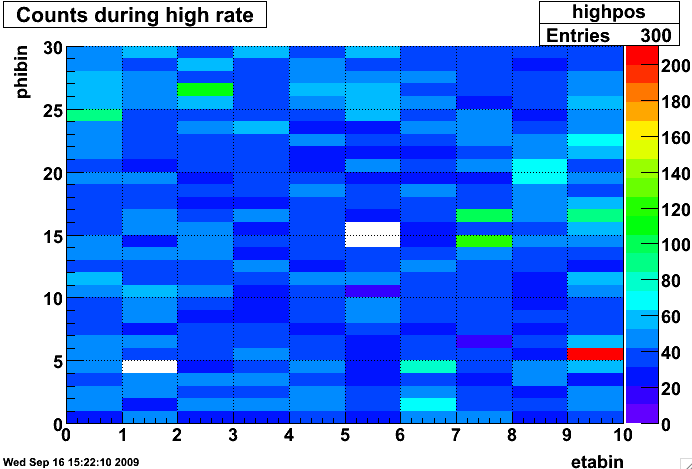
Figure 2. Trigger rate by patch, integrated over the time ranges where the two beams have a small offset. The patches are arranged in eta-phi space, with etabin=0 corresponding to eta=-1. Some hot patches are seen, but if there is structure it is being washed out compared to the previous figure.
I do not know the phi mapping between this and physical phi, but the top middle corresponds to patch 0.
- rcorliss's blog
- Login or register to post comments