- rcorliss's home page
- Posts
- 2013
- January (1)
- 2012
- 2011
- 2010
- December (1)
- October (2)
- September (2)
- August (2)
- June (2)
- May (3)
- April (3)
- March (5)
- February (2)
- January (8)
- 2009
- December (5)
- November (1)
- October (7)
- September (10)
- August (4)
- July (3)
- May (1)
- February (1)
- January (1)
- 2008
- 2007
- My blog
- Post new blog entry
- All blogs
bXing plots for vernier scans.
I broke down the vernier scan run 10097097 by bunch crossing using mudst->event()->l0Trigger().bunchCrossingId7bit(mRunNo) , incrementing the histogram for every patch that's above threshold, meaning it's possible to have more than one entry per event (though this should be relatively rare.
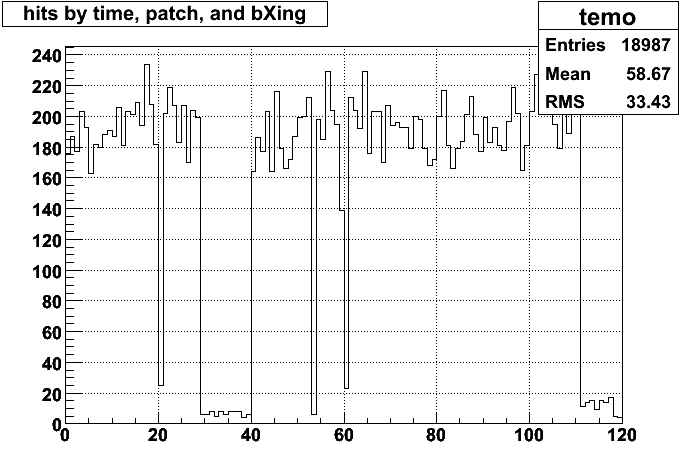
Looking at these histograms made me realize something obvious - since the two abort gaps don't line up, a 109x107 store (like run 10097097's) doesn't have ~108 beam crossings, but something more like (120 - 11 - 13 = )96. This is a 10% difference from the number of filled bunch crossings I've been using up until now. These numbers don't quite line up, depending on how you count the 'empty bins of the bxing plot:

Figure 1. Hits as a function of beam crossing in run 10097097. This is a 1D projection of a 3D histogram, hence the strange title. There are 20 bins in two continuous groups that should be the two abort gaps, and three more empty bins that are elsewhere, leaving 97 bunch crossings where both beams have filled bunches. This isn't quite the number expected from the numbers above, but it's far closer (one more bunch, 59, seems to be half-filled and may be marked as missing as well).

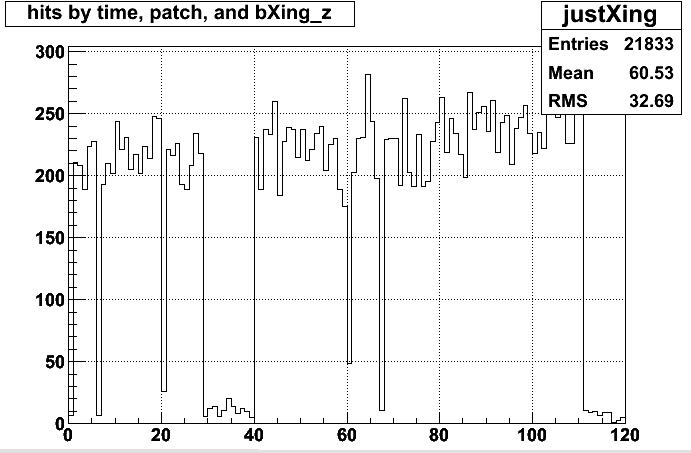
Figure 2. Hits as a function of beam crossing in run 10103044. The plot is produced just as in figure 1. The two abort gaps remain in the same place, as do some of the other missing bunches.
There seem to be three areas of interest: the abort gap from 30-40, the gap from 110-120, and the three or four bins that are not in those two regions, but still low. I'll investigate the contribution these regions have to the vernier scan plots in another blog entry. I'll also correct the number of filled bunch crossings, which should change listed cross sections by ~10%.
- rcorliss's blog
- Login or register to post comments
