- rcorliss's home page
- Posts
- 2013
- January (1)
- 2012
- 2011
- 2010
- December (1)
- October (2)
- September (2)
- August (2)
- June (2)
- May (3)
- April (3)
- March (5)
- February (2)
- January (8)
- 2009
- December (5)
- November (1)
- October (7)
- September (10)
- August (4)
- July (3)
- May (1)
- February (1)
- January (1)
- 2008
- 2007
- My blog
- Post new blog entry
- All blogs
Rates in different bXing subsets
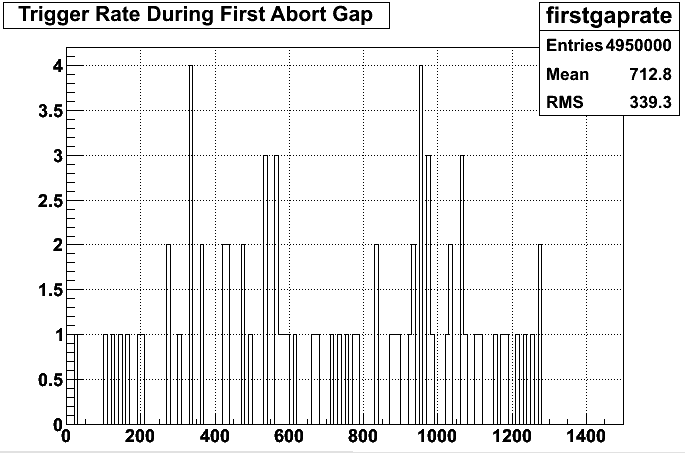
Following from the previous blog post, I investigated the rates in each of the three regions.

Figure 1. The BHT3 rate as a function of time in the first abort gap. In order to overcome very limited statistics I binned in ten second intervals, so the actual count rate is one tenth of what's shown here. There doesn't seem to be any dependence on beam position, and the rate is too small to be the source of the background seen in previous fits.

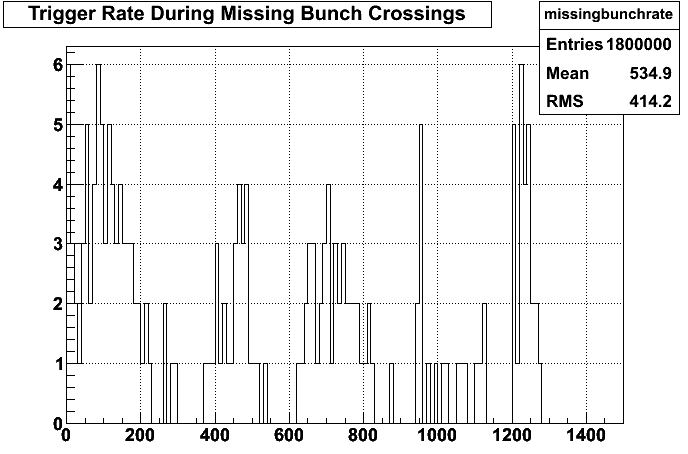
Figure 2. The BHT3 rate as a function of time in the second abort gap. The binning is the same as previously. Once again there doesn't seem to be a particularly strong dependence on the position of the beam. The count rate is higher than the first abort gap, but still low.

Figure 3. The BHT3 rate in other partially filled bunch crossings. The binning is once again in ten second intervals. Here we see some vernier scan structure. This is probably dominated by the mostly-filled bin 59. Also note there are very few counts in the regions at maximum displacement, fewer than are seen in the plots for the abort gaps.
The fact that neither of the abort gaps showed a dependence on the beam position makes me more confident that the background rate is flat rather than ahving a beam dependence itself.
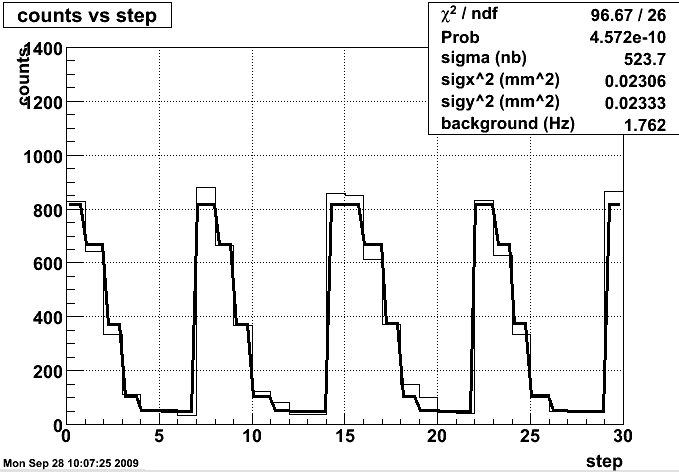
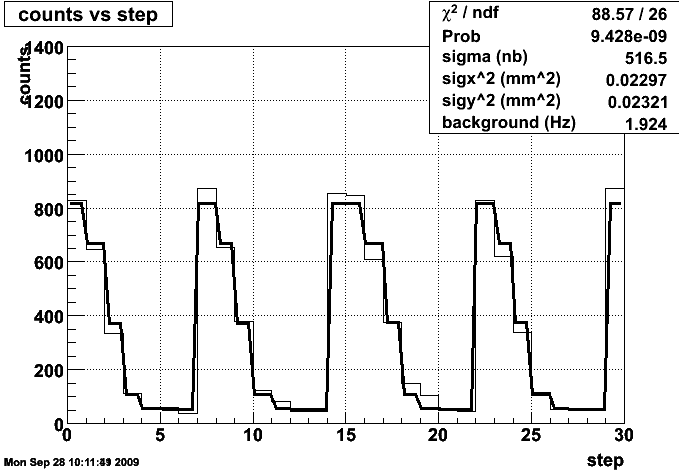
I was unable to see a difference between the raw rate for all the bxings and the rate for just the good ones, but I ran both through the vernier scan fit to see what the differences would be. Note that these two plots contain the ~10% correction from the smaller number of filled crossings.

Figure 4. The fitted BHT3 vernier scan for only the bunch crossings not contained in the figs 1-3.

Figure 5. The fitted BHT3 vernier scan for all the bunch crossings together. I'm surprised that the difference between the two is so small. We removed ~20 abort gap bins (~20% of the total) , so the drop from 1.9 to 1.7 in the background rate (10%) isn't too far off from what we'd expect if there were a similar flat rate in all the bunch crossings. It's interesting to note that the rate increased somewhat.
I realize I somehow lost the error bars on the fit, which I will correct in a coming post, along with hopefully more improvements.
- rcorliss's blog
- Login or register to post comments
