- rcorliss's home page
- Posts
- 2013
- January (1)
- 2012
- 2011
- 2010
- December (1)
- October (2)
- September (2)
- August (2)
- June (2)
- May (3)
- April (3)
- March (5)
- February (2)
- January (8)
- 2009
- December (5)
- November (1)
- October (7)
- September (10)
- August (4)
- July (3)
- May (1)
- February (1)
- January (1)
- 2008
- 2007
- My blog
- Post new blog entry
- All blogs
Making a Poor Man's BHT3 Coincidence trigger
To try to understand why the shape of the vernier scan data differs between the ZDC and BBC and the BHT3 triggers, I decided to make a rough sort of BHT3 coincidence trigger. In each BHT3 event, I find the highest trigger patch value, then sum up the values in the opposite third of the detector (out of 30 phi bins, I take all that are >10 units away from the high patch). Plotting the ratio of summed patch to highest patch vs time, we can see the vernier scan structure looks very different at different ratios:
.png)
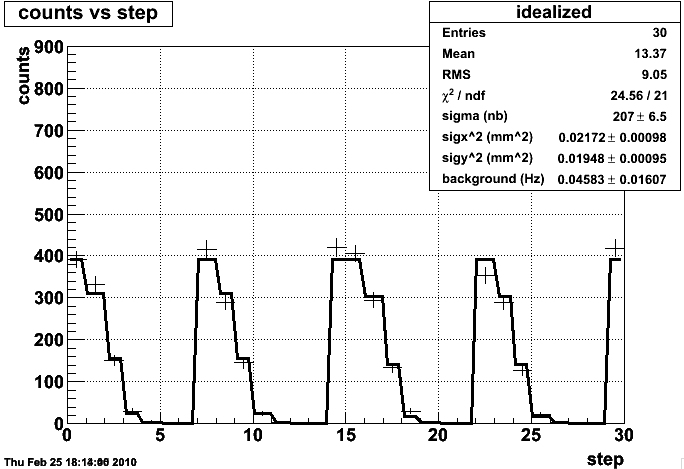
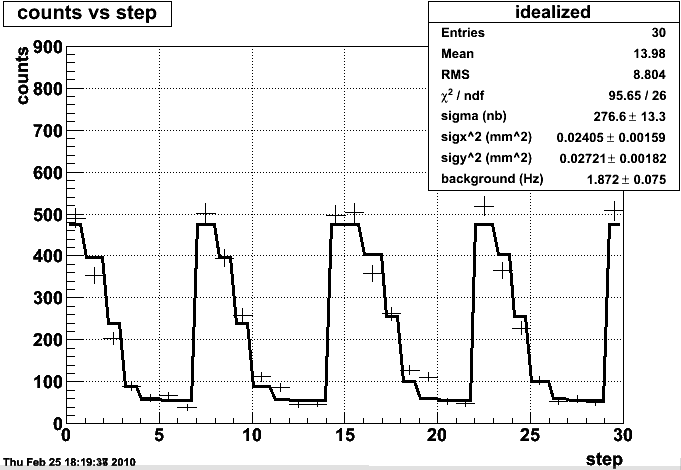
I can perform the vernier scan fit on two subsets - ratio above three, and ratio below three.
Above three:

Below three:

We see that above three the background has dropped to a negligible rate, and the nongaussian features are gone - our chi squared per degree of freedom is close to one. Below three, the nongaussianity and background rates are high, and we see a much higher chi2/dof.
Obviously I need to think about this a while longer - imposing this sort of condition might be dangerous, as it might be more susceptible to noise, or vary more over the course of the run than the overall cross section did. Still, it's encouraging to find a structure that looks like the BBC and ZDC, to verify that at the core of the BHT3 trigger we're still seeing the same beam.
More to come.
- rcorliss's blog
- Login or register to post comments
