- rcorliss's home page
- Posts
- 2013
- January (1)
- 2012
- 2011
- 2010
- December (1)
- October (2)
- September (2)
- August (2)
- June (2)
- May (3)
- April (3)
- March (5)
- February (2)
- January (8)
- 2009
- December (5)
- November (1)
- October (7)
- September (10)
- August (4)
- July (3)
- May (1)
- February (1)
- January (1)
- 2008
- 2007
- My blog
- Post new blog entry
- All blogs
validating a flat background in the vernier scans
In response to the vernier scan analysis write-up, Carl raised the question of how flat the backgrounds in the vernier scans are. Due to a lack of statistics, it's hard to look at the background levels as a function of time or of the beam position. If we assume that any non-flat background will only depend on the magnitude of the beam displacement, though, we can sum all four stages of the vernier scan into a single plot:

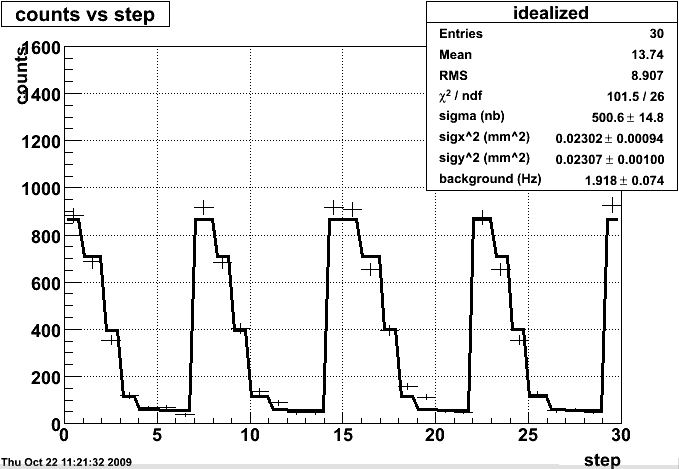
Figure 1. A typical vernier scan plot with fit function shown. In the following, we sum together the four distinct peaks.
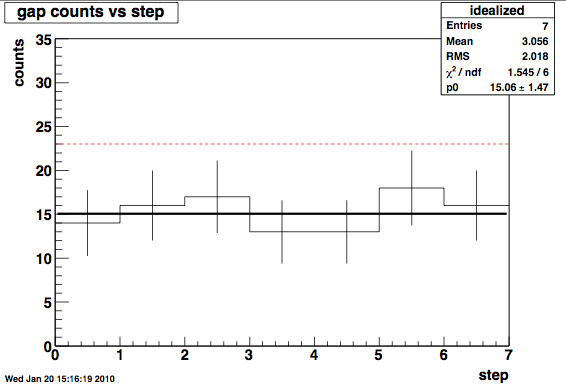
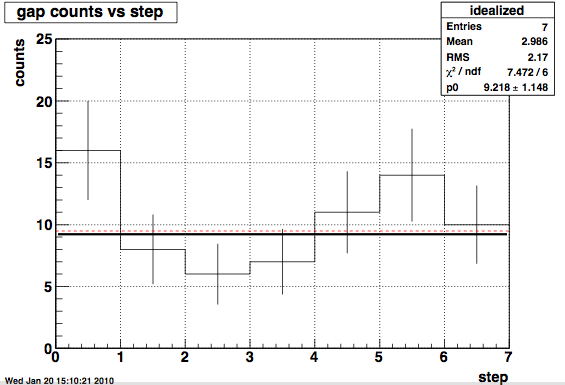
The plots that follow show the integrated abort gap yield (summing both gaps together) as a function of step, where step 0 is the sum of bins 0,7,15, and 22, and the following steps are 1+8+16+23 etc. The black line is the best-fit constant, the red dotted line is the background rate from the fit multiplied by 4 windows*30 seconds/window, then scaled to the number of bunches in the abort gap:
red=R_back*4*30*10/110
The assumption of 110 filled bins and an abort gap width of 10 is not exact, but is only off by ~few.

Figure 2. The total number of abort gap rates summed over all four sweeps of the vernier scan in run 10097097. bin zero is the peak of each sweep, bin one the first step away from the peak, etc. The dotted red line is unfortunately offset. It should be at 1.918Hz *4*30 *10/110=21.

Figure 3. The total number of abort gap rates summed over all four sweeps of the vernier scan in run 10103044, as in Figure 2 above. The dotted red line follows the same prescription, and is once more offset. It should be at .79*4*30*10/110=8.6.
Both these distributions are consistent with the assumption of a flat background. It seems reasonable to continue to use the current model, and to characterize the uncertainty by varying the background value ~25%.
- rcorliss's blog
- Login or register to post comments
