2012/2013 500 GeV Dijet Projections
GOAL: Estimate asymmetry error bars for the 82pb-1/55% pol. of data collected in 2012 and for the 165 pb-1/55% projected in 2013.
TABLE I: Trigger Summary for 2012 (plan for 2x statistics for 2013):
| Trig | DSMadc | GeV | Stats |
| JP0 | 28 | ~5.4 | 175M |
| JP1 | 36 | ~7.3 | 164M |
| JP2+AJP | 66+(28) | ~14.4 | 82pb-1 |
It is difficult to estimate the contribution from JP0/JP1 because previous 500 GeV running implemented different thresholds. In 2009 there was no JP0 trigger and thresholds were set as JP2=(60, 13 GeV), JP1=(40, 8.2 GeV), JP0=(32, 6.3 GeV). Note JP0 thresholds were used in AJP trigger but not in standalone trigger. Similarly for 2011 the thresholds were JP2=(64,?), JP1=(43,?), JP0=(32,?). However the 2009 200 GeV JP2/JP1 thresholds are set at the same values as the 2012/2013 JP0/JP1 values.
TABLE II:Trigger Summary for 2009 200 GeV
| Trig | DSMadc | GeV | Stats |
| JP1 | 28 | ~5.4 | 111.28M |
| JP2 | 36 | ~7.3 | 62.02M |
Here is the plan:
- Assume similar data collection efficiency for each year
- Assume similar jet reconstruction eff per invM bin for triggers with the same threshold
- Use 2009 500 GeV JP2+AJP yields for 2012/2013 JP2+ADJP (500GeV_2009_JP2_dijet_Imass.gif below)
- Use 2009 200 Gev JP2 yields for 2012/2013 JP1 (200GeV_2009_JP2_dijet_Imass.gif)
- Use 2009 200 GeV JP1 yields for 2012/2913 JP0 (200GeV_2009_JP1_dijet_Imass.gif)
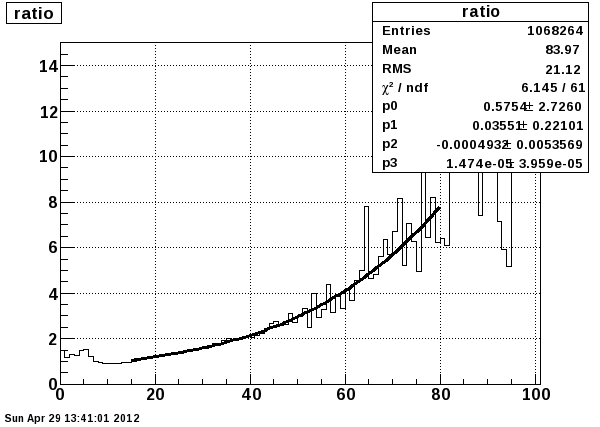
- Scale #3 & #4 by ratio of 500/200 GeV dijet Xsec (Pythia_200.gif,Pythia_500.gif,Ratio_pol2.gif,Ratio_pol3.gif)
The increase in Yield from 200 to 500 GeV was estimated by running PYTHIA 6.4 Perugia Tune0 for 200 and 500 GeV. The dijet invarient mass was estimated by the momentun, eta and phi of the outgoing scattered partons. The ratio of 500/200 was found and parameterized with both a 2nd and 3rd order polynomial. A shift from parton to detector must be estimated and then this curve applied to the 200 GeV data.
FIGURE I:

In Tai's thesis he notes that the invariant mass shifts for the asymmetries in 2006 are:
20.00-30.01 = -1.243
30.01-48.83 = 0.127
48.83-85.92 = 3.991
These bins are large and I will use smaller binning so I will disregard bins shifts at this point.
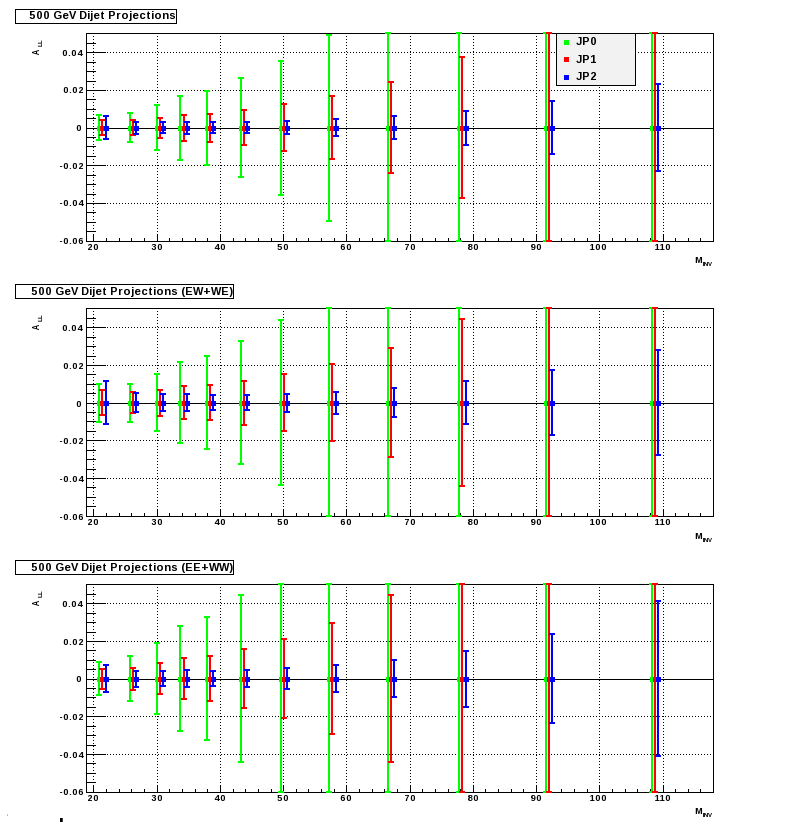
FIGURE II: Estimated errors for each trigger for 2012 FOM. Top plot is for |eta|<0.8, middle plot keeps eta cuts but requires one jet in E and one in W, bottom plot require both jets in either the E or the W. The general trend is reasonble with EW showing larger(smaller) errors at low(high) pT compared to EE+WW. Note that this binning is smaller than used for the 2009 dijet aLL. It is taken from Tai's dijet Xsec binning. I also have all of the histograms for wider symmetric bins used in the 2009 aLL plots.

- rfatemi's blog
- Login or register to post comments
