MinuitVF tuning for 7 GeV Au+Au collisions
Goal: Tune MinuitVF for use with 7 GeV Au+Au data
bfc chain options are: "P2010a,pmdReco,btof,BEmcChkStat,QAalltrigs,Corr4,OSpaceZ2,OGridLeak3D,-hitfilt"
library used: stardev (starnew is currently SL10h)
StMinuitVertexFinder.cxx ver 1.21, StMinuitVertexFinder ver 1.11
"good" vertices are defined as |Vz|< 70 cm and Vr < 2 cm (A portion of these vertices will be assymetric, likely from beam-gas interactions, and selecting against these is also under study. However, this is not a job for the vertexer....)
filelist:
st_physics_adc_11116012_raw_3490001
st_physics_adc_11116063_raw_1520001
st_physics_adc_11119033_raw_2500001
# events = 666
Variables we can tune: mMinNumberOfFitPointsOnTrack, mDcaZMax, mMinTrack, mRImpactMax
We have decided not to change the number of track fit points, so we will only look at the later 3 (I refer to as Z, N and R respectively for the rest of the document)
We can also adjust weighting factors in void StMinuitVertexFinder::calculateRanks():
avg_dip_expected = -0.0033*primV->position().z();
n_bemc_expected = (float)primV->numTracksUsedInFinder()/nVtxTrackTot*nBemcMatchTot;
n_cross_expected = fabs(primV->position().z())*0.0020*primV->numTracksUsedInFinder();
Conclusions:
Start by varying RZN from default of (1.5,3,5)
| Scenerio (R,Z,N) | # Events w/vertex | # Events w/good Vertex (in top 6) | ave # vertices/event |
| 1.5,3,5 (default) | 55 / 666 | 20 / 666 | 0.084 |
| 1.5,3,2 | 151/666 | 48 / 666 | 0.348 |
| 3,3,5 | 101/666 | 24 / 666 | 0.188 |
| 1.5,6,2 | 202/666 | 51 / 666 | 0.481 |
| 3,6,2 | 304/666 | 44 / 666 | 1.008 |
| 3,3,2 | 255/666 | 50 / 666 | 0.817 |
| 6,6,2 | 368/666 | 36 / 666 | 1.548 |
| 6,6,5 | 193/666 | 21 / 666 | 0.455 |
| Alex's Finder | 339/666 | 30 / 666 | 0.509 |
Table 1a: Vertex finding statistics for various scenrios. Alex's vertex finder finds vertices beyond the TPC, but I have limited the # in the first collumn to those within |Vz|<200 for a fair comparison. It also finds a single vertex per event.
| Scenerio | # good | index 0 | index 1 | index 2 | index 3 | index 4 | index 5 |
| 1.5,3,5 (default) | 20 | 20 | 0 | 0 | 0 | 0 | 0 |
| 3,3,5 | 24 | 23 | 0 | 0 | 1 | 0 | 0 |
| 1.5,3,2 | 48 | 37 | 10 | 1 | 0 | 0 | 0 |
| 1.5,6,2 | 51 | 37 | 13 | 1 | 0 | 0 | 0 |
| 3,6,2 | 44 | 28 | 9 | 4 | 3 | 3 | 0 |
| 3,3,2 | 50 | 30 | 7 | 9 | 4 | 2 | 0 |
| 6,6,2 | 36 | 25 | 5 | 4 | 2 | 4 | 0 |
| 6,6,5 | 21 | 20 | 0 | 1 | 0 | 0 | 0 |
Table 1b: "Good" vertices sorted by index. Our goal is to maximize the # of good vertices as index 0.
| Scenerio (R,Z,N) | Vx vs Vy | Vx vs Vz | Vy vs Vz |
|
1.5,3,5 (default) More Statistics |
.gif) |
.gif) |
.gif) |
| 1.5,6,2 | 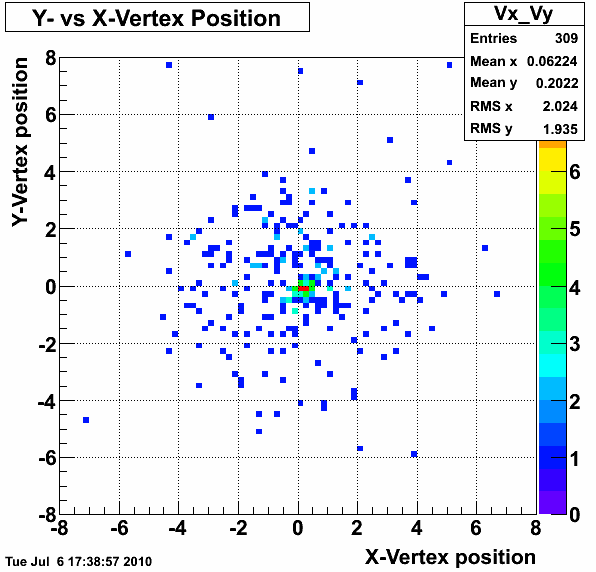 |
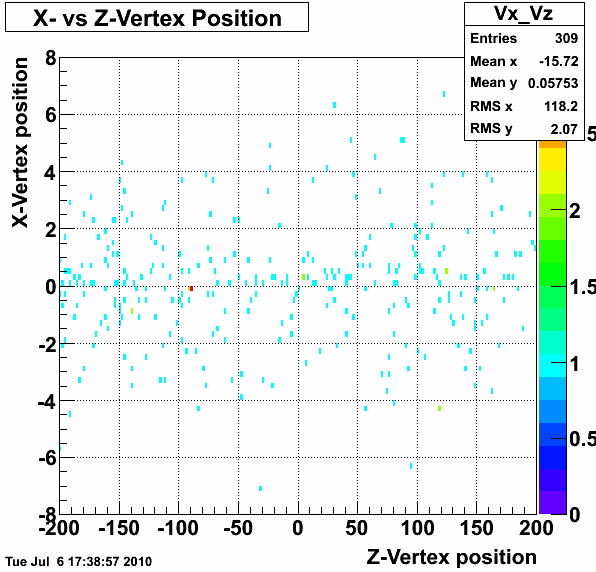 |
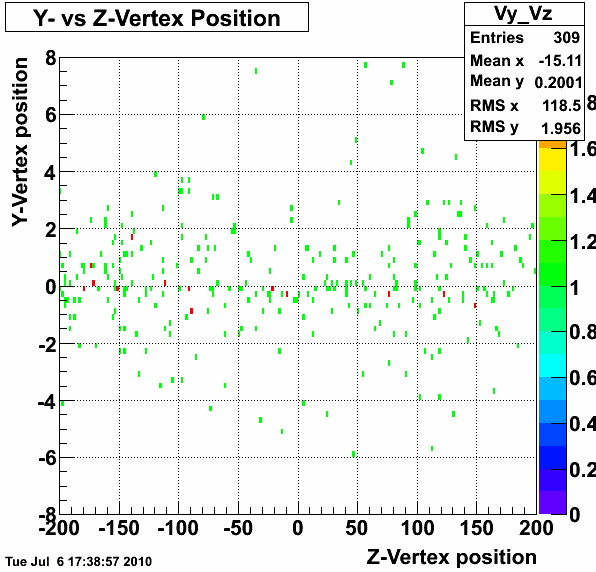 |
| 3,6,2 | 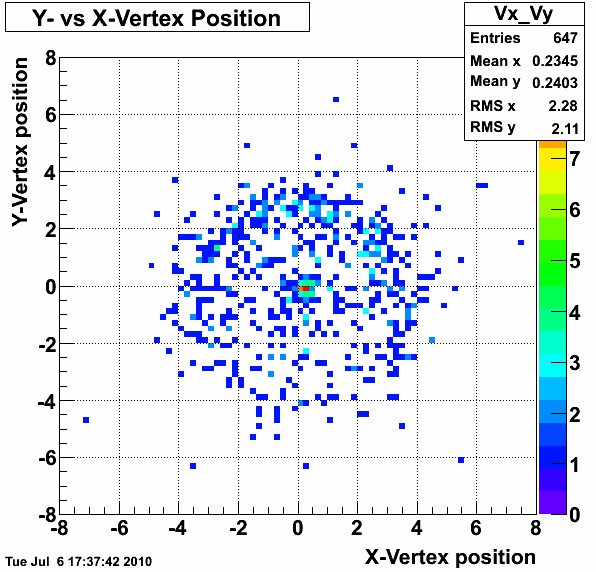 |
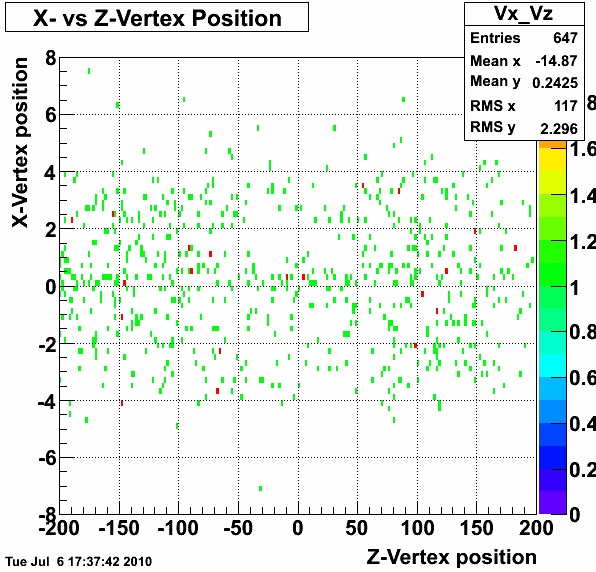 |
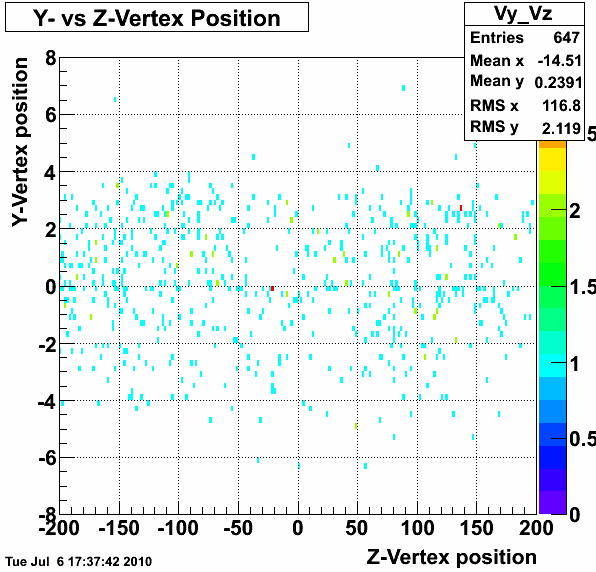 |
| 3,3,2 | 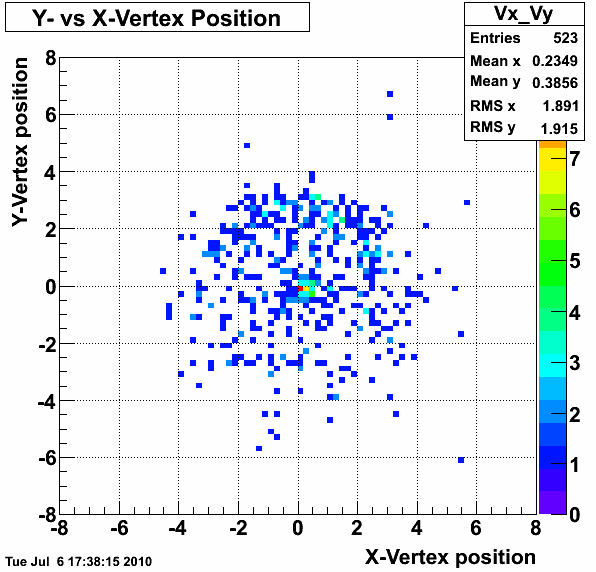 |
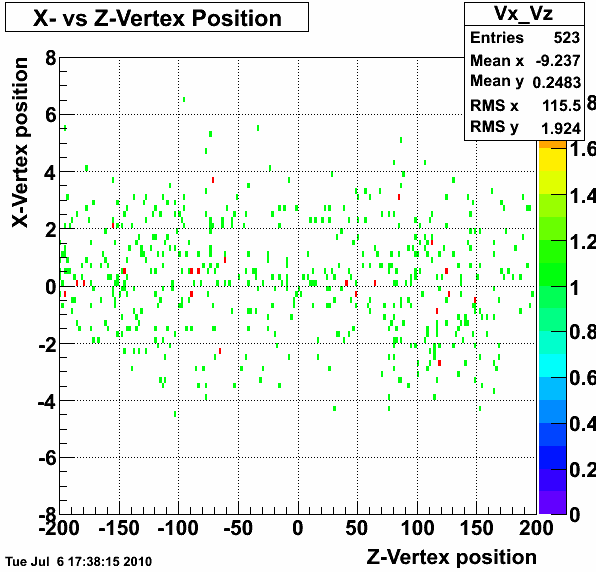 |
 |
|
6,6,2 More Statistics |
.gif) |
.gif) |
.gif) |
|
6,6,5 More Statistics |
.gif) |
.gif) |
.gif) |
| Alex's Finder |
Table 1c: Radial locations of "Good" vertices with index 0. First, the average beam location is found by fitting the central peak. Then, the radial distance from that peak is calculated. To get something (artificially) symmetric about zero to make fitting easier, the radial distance is multiplied by the sign on the X location. The histogram name shows the input parameter set and some RZN selections have more statistics than other which are indicated in the row titles.
xxxx
 |
 |
 |
 |
 |
 |
 |
Table 1d:Fit parameters for histograms above. For the beam pipe, the two values are averaged. The Beam Yield is the integral of the fitted Gaussian. the typical uncertainties are 0.05 in the beam sigma and 4-5 in the amplitude, giving about +/-10 in the integrated yield. With these statistics, it's impossible to conclude much about the central beam spot yield.
| Parameter set | Beam Mean | Beam Sigma | Beam Yield | Pipe Mean | Pipe Sigma |
| Default | -0.03 | 0.35 | 50.1 | - | - |
| 1562 | -0.01 | 0.44 | 58.2 | 3.0 | 1.1 |
| 362 | 0.01 | 0.39 | 39.2 | 3.2 | 0.85 |
| 332 | 0.03 | 0.44 | 52.2 | 2.8 | 0.74 |
| 335 | 0.01 | 0.35 | 47.6 | 2.7 | (0.32) |
| 662 | 0.04 | 0.30 | 40.2 | 3.7 | 0.76 |
| 665 | 0.01 | 0.28 | 39.2 | 3.5 | 0.70 |
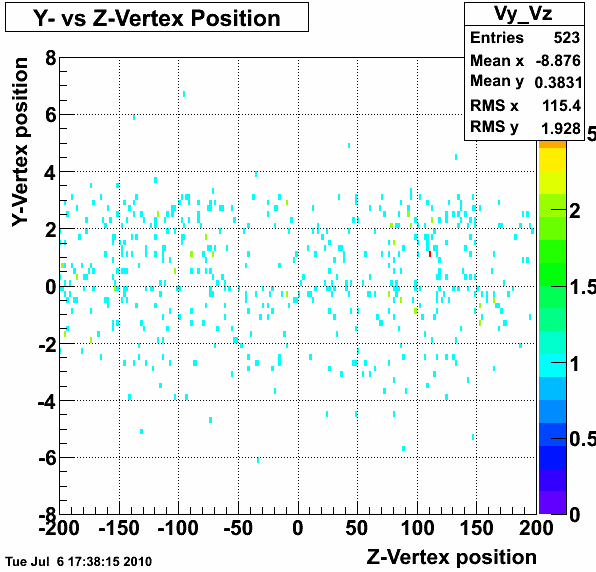
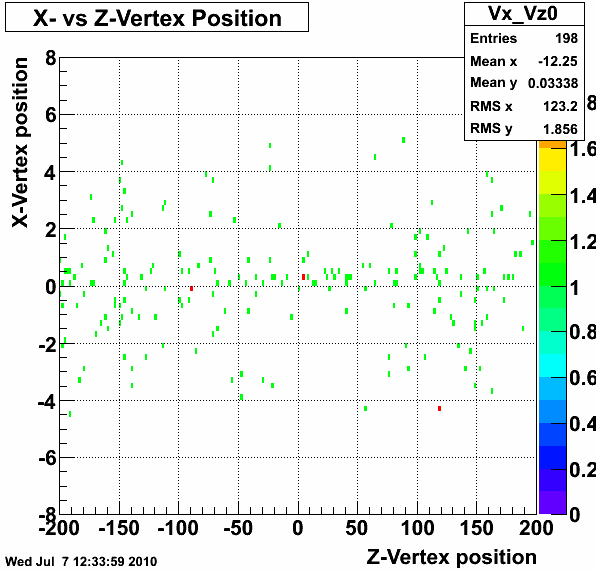
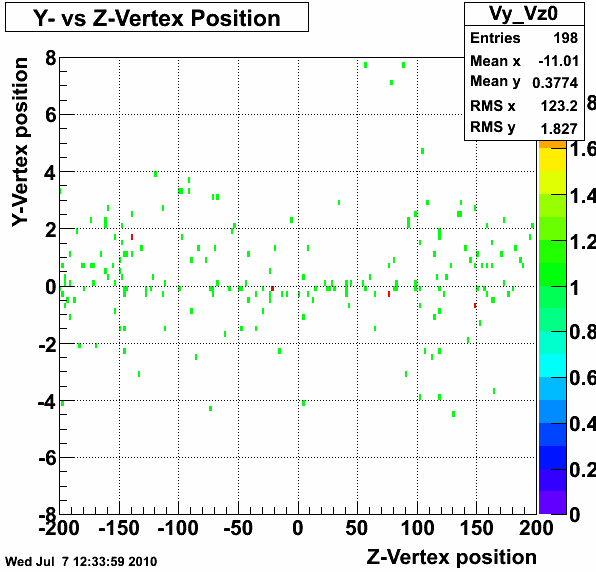
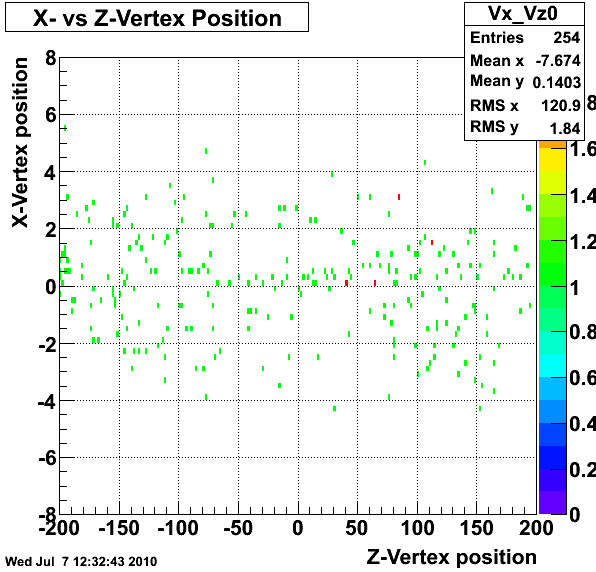
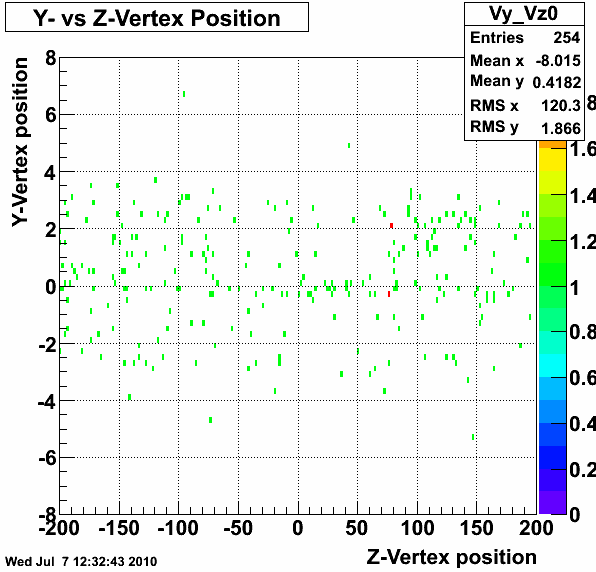
Table 2a: Vertex distributions (include every vertex found with indices 0-5)
|
Scenerio (R,Z,N) |
Vy vs Vx | Vx vs Vz | Vy vs Vz |
|
1.5,3,5 (default) More Statistics |
.gif) |
.gif) |
.gif) |
| 1.5,6,2 | 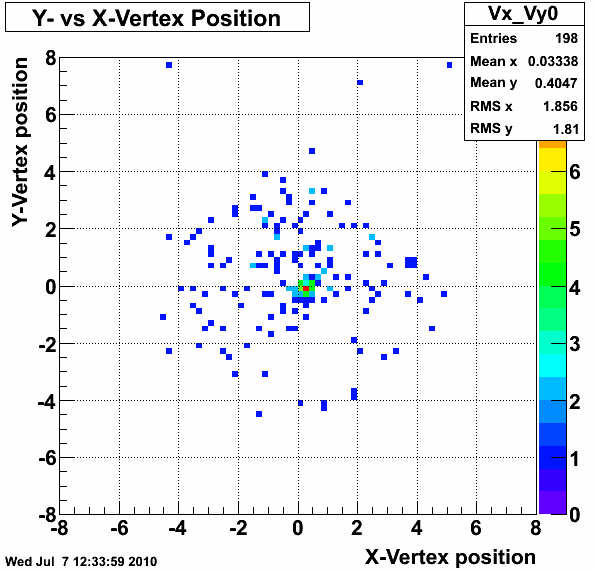 |
 |
 |
| 3,6,2 | 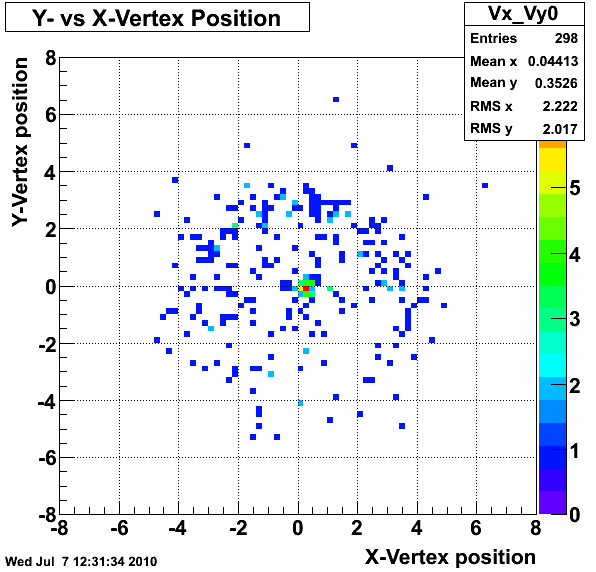 |
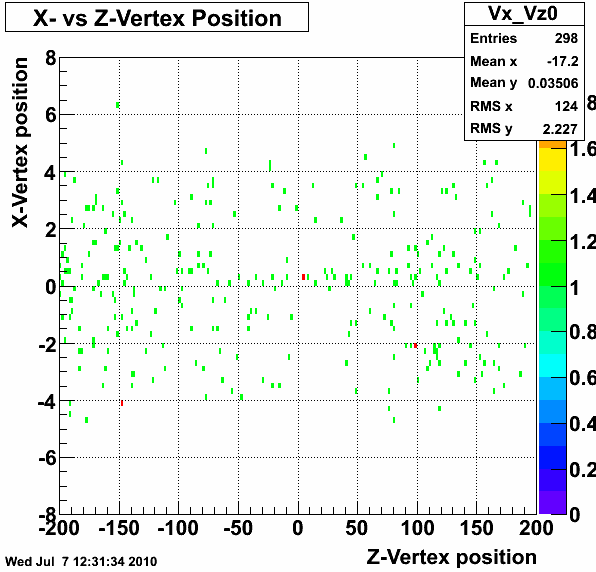 |
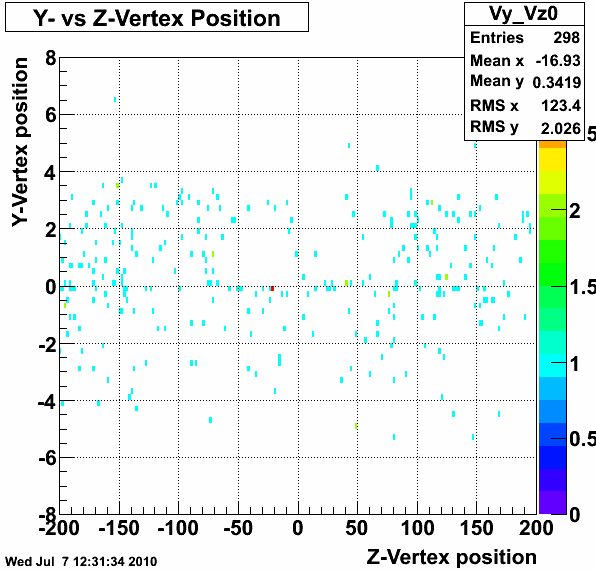 |
| 3,3,2 | 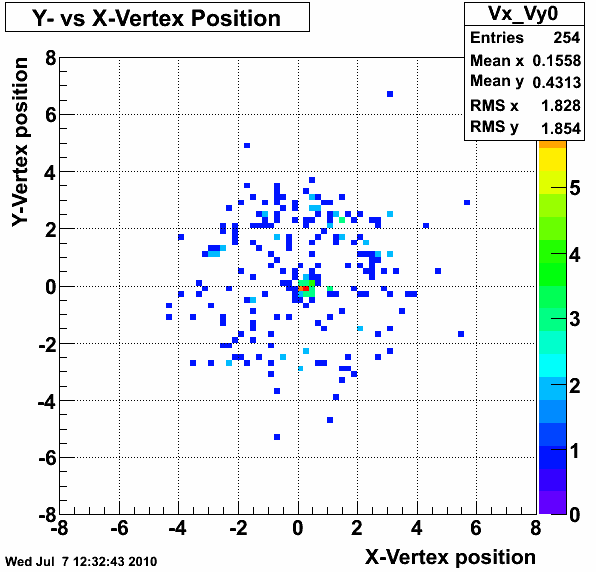 |
 |
 |
|
6,6,2 More Statistics |
.gif) |
.gif) |
.gif) |
|
6,6,5 More Statistics |
.gif) |
.gif) |
.gif) |
Table 2b: Vertex distributions with index 0
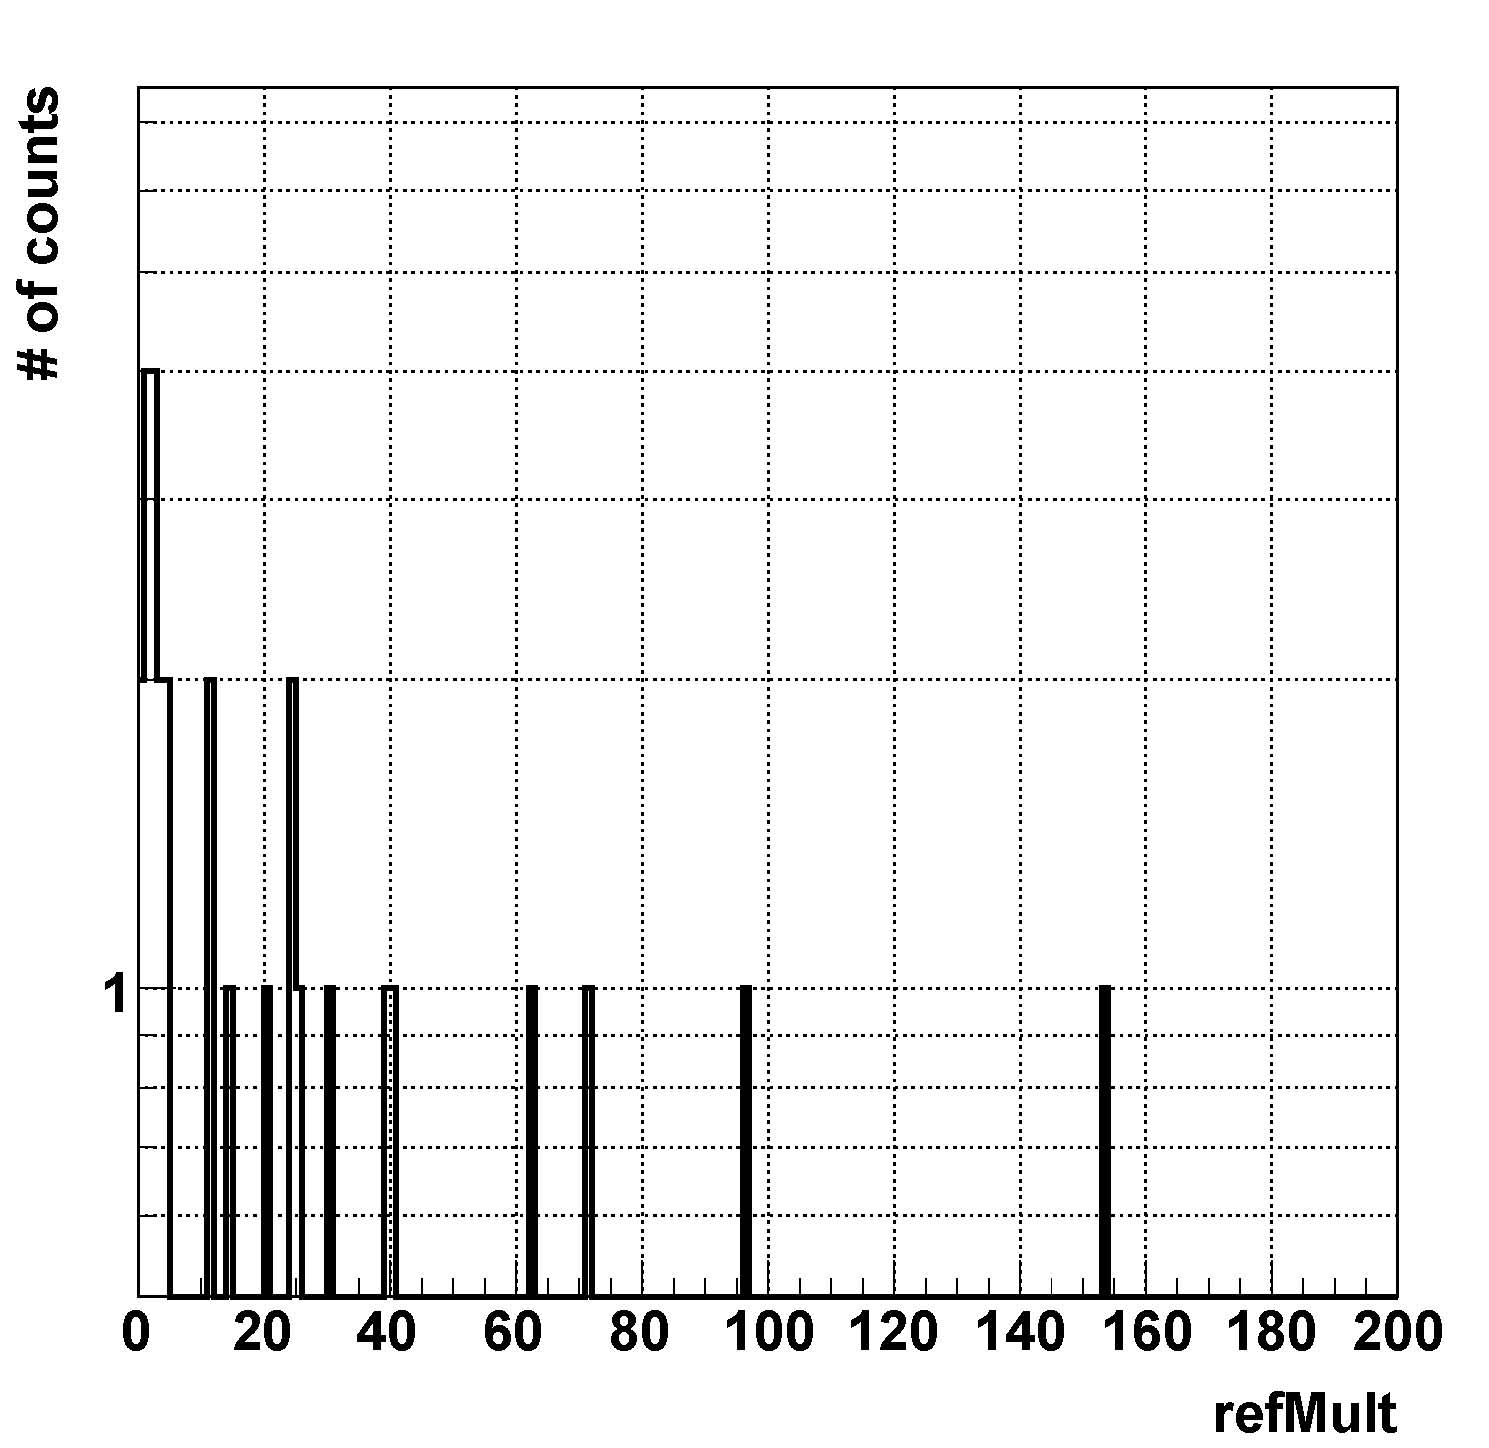
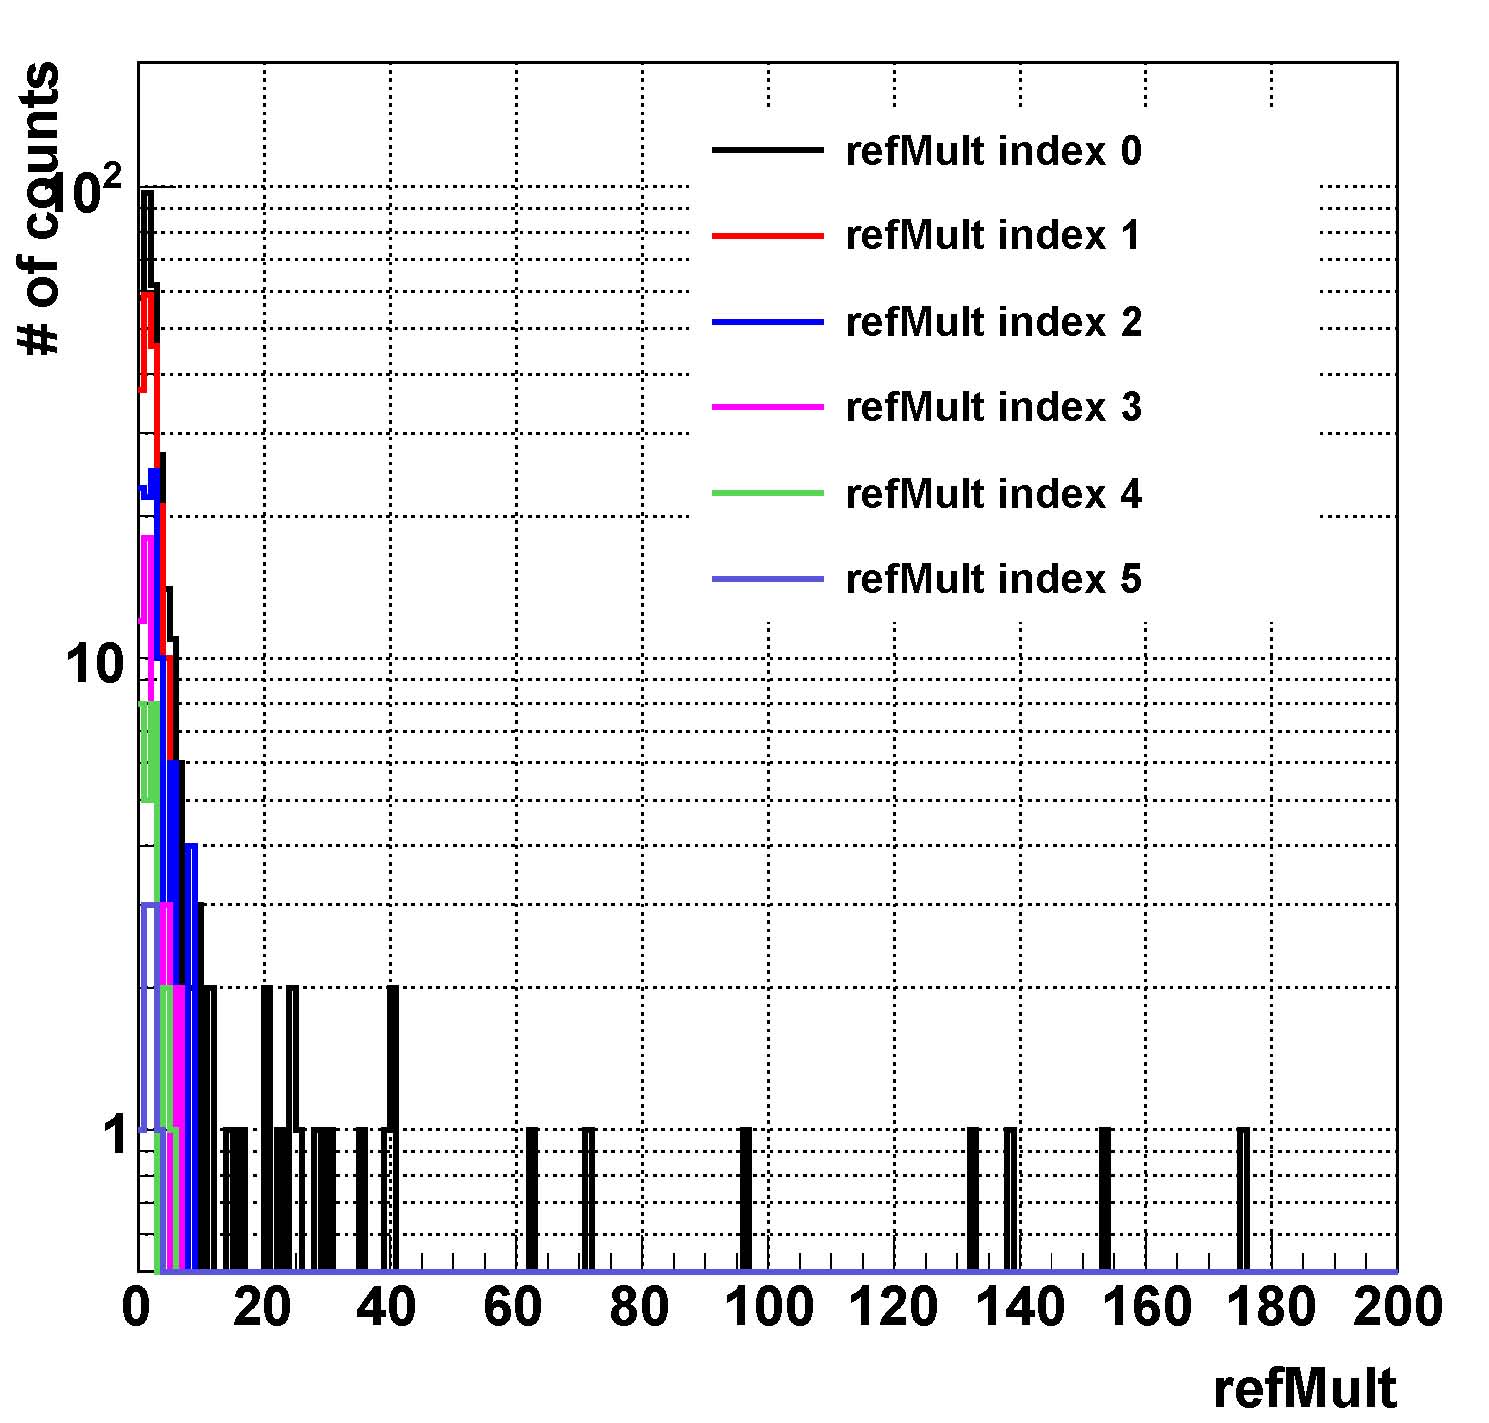
| Scenerio (R,Z,N) | RefMult0 | RefMult0 (|Vz0|<70&Vr<2) | RefMultAll |
| 1.5,3,5 (default) | 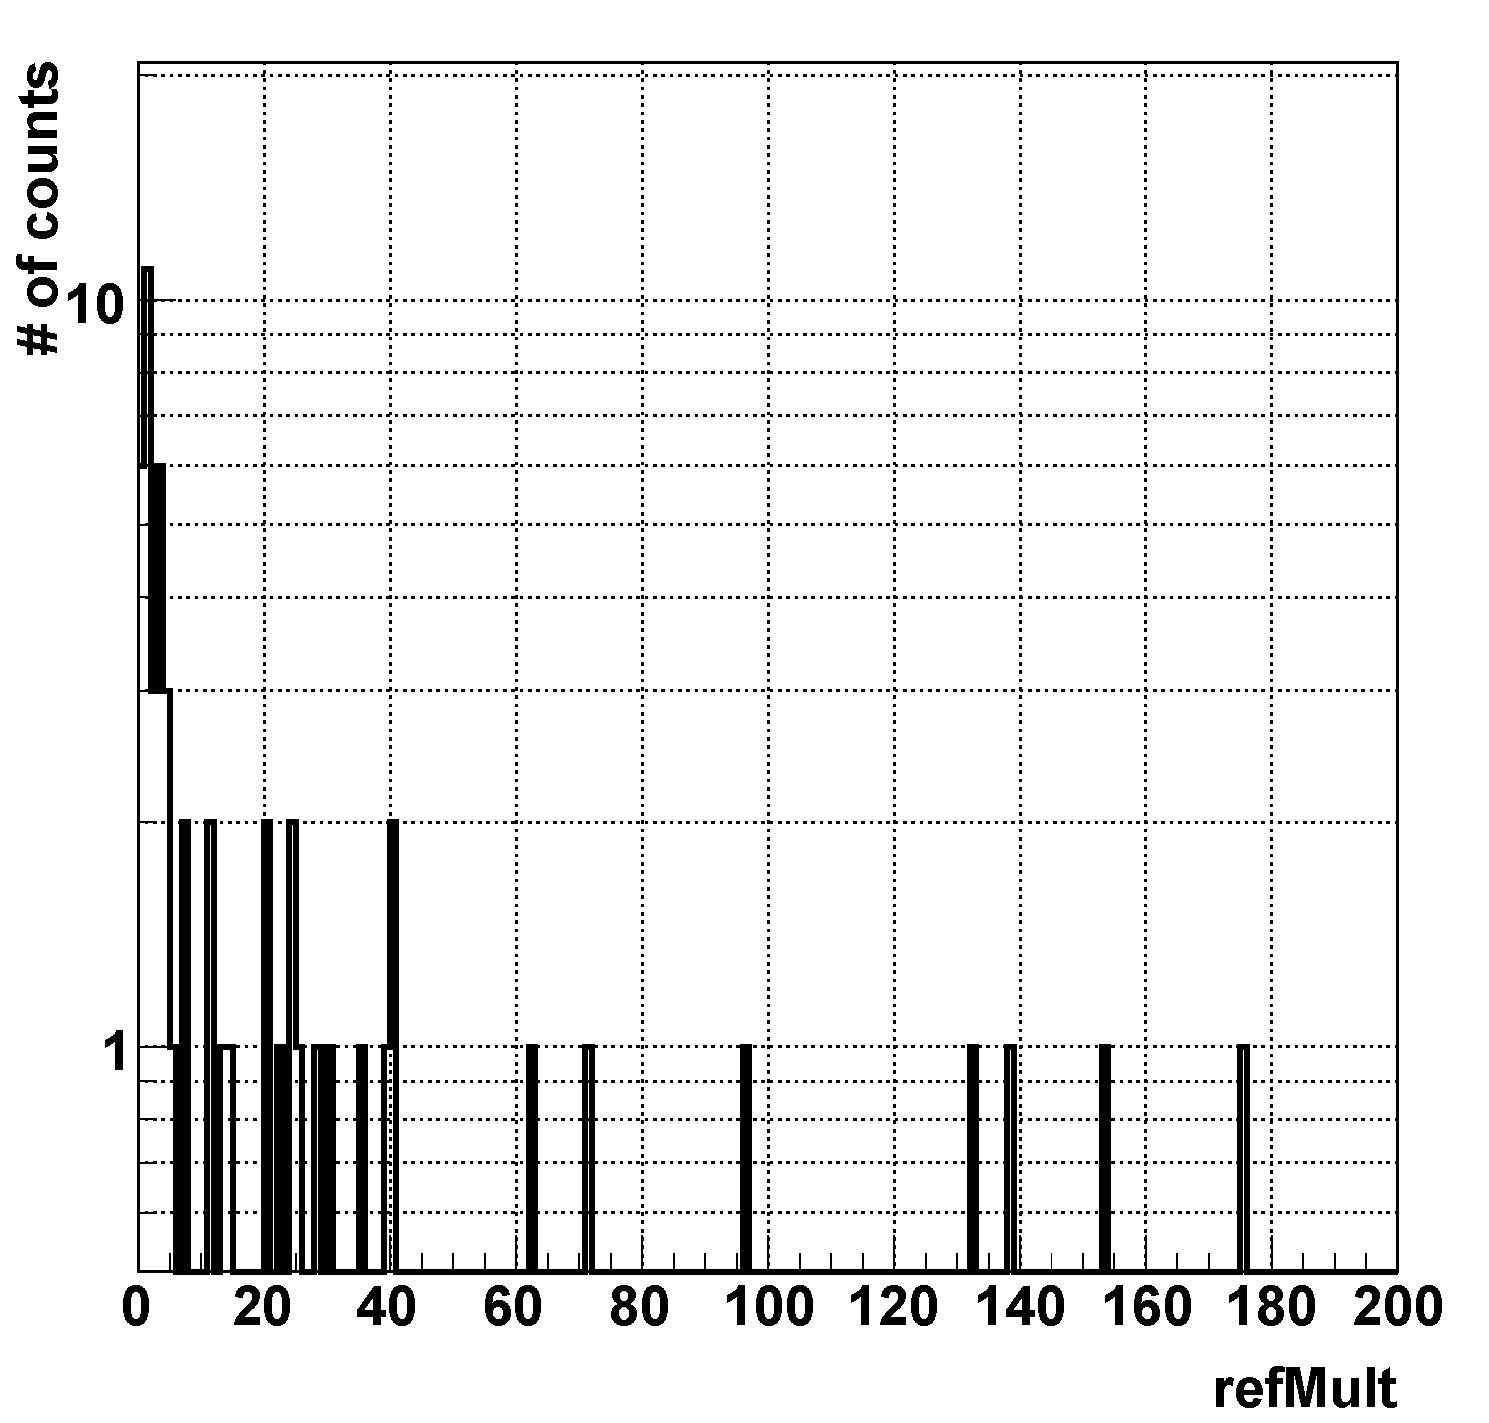 |
 |
 |
| 1.5,6,2 | 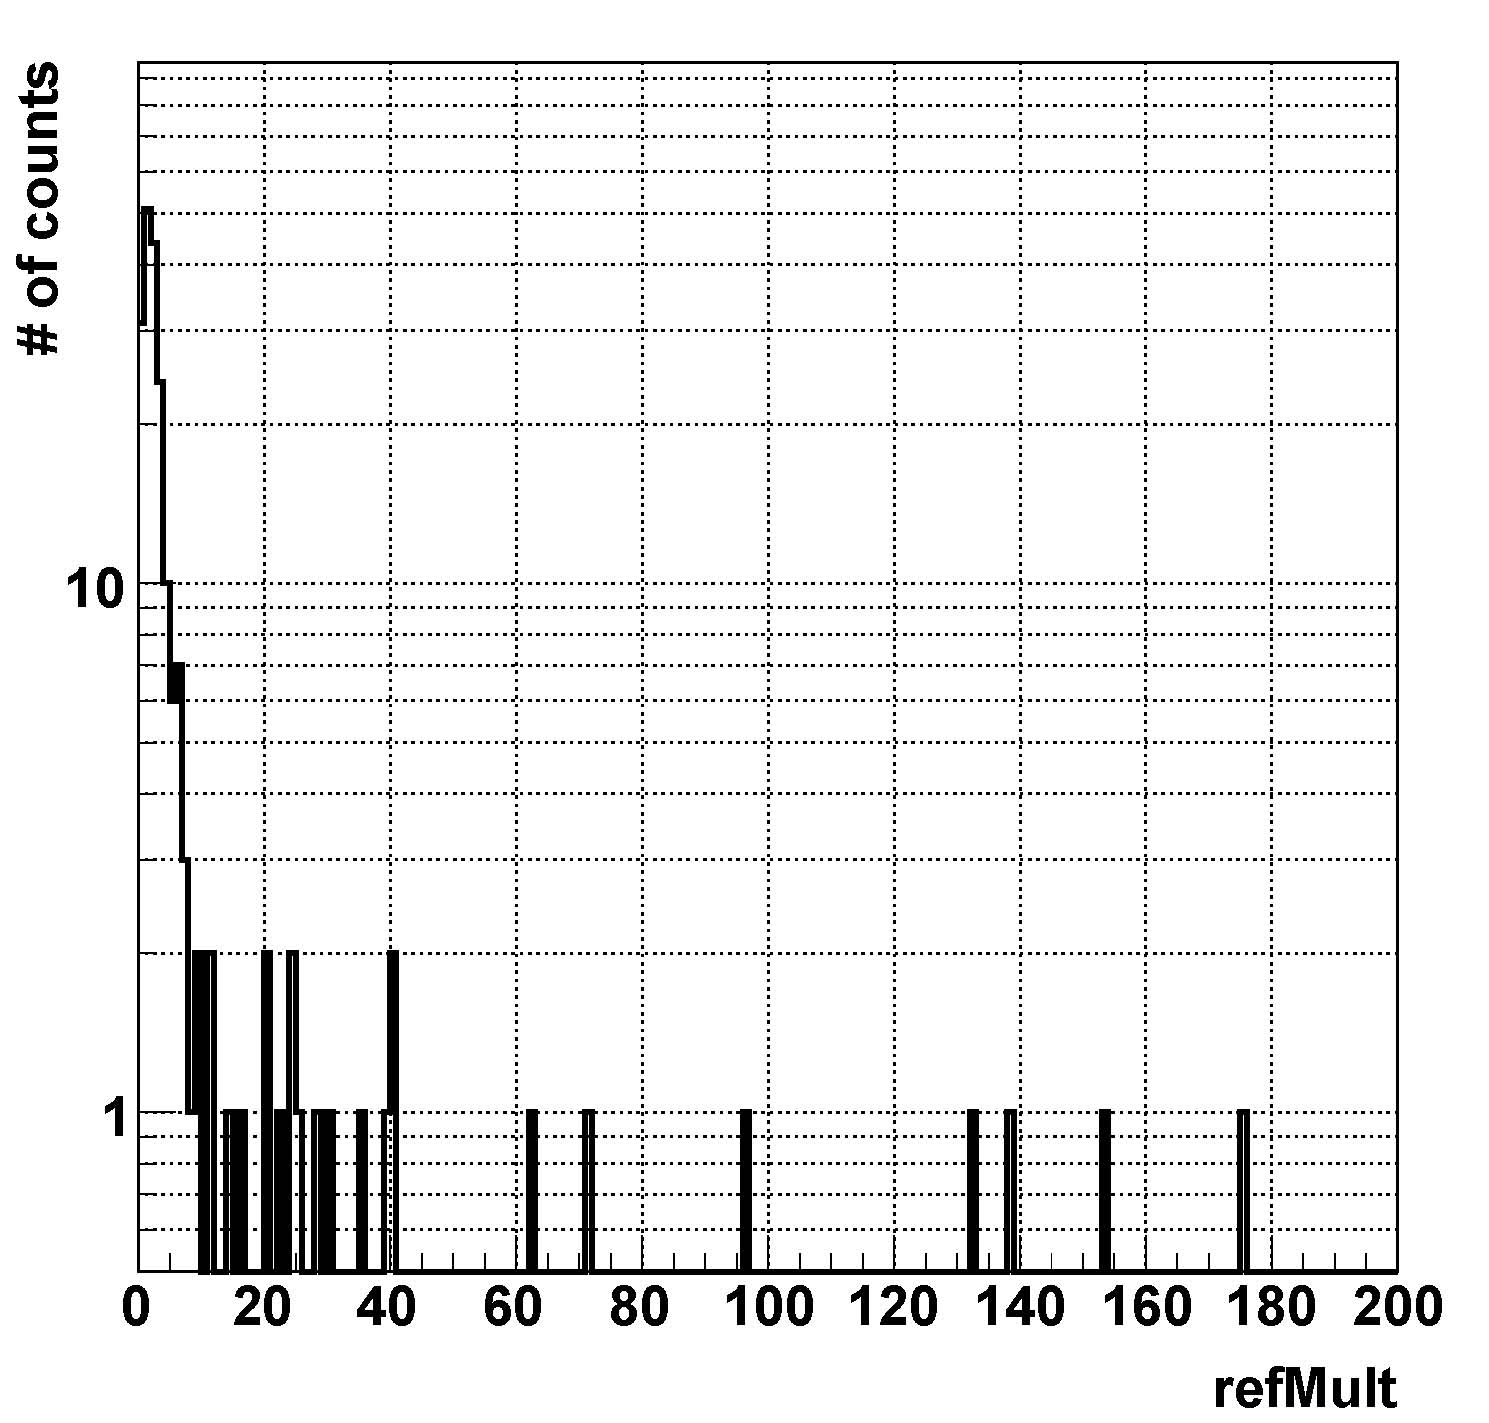 |
 |
 |
| 3,6,2 | 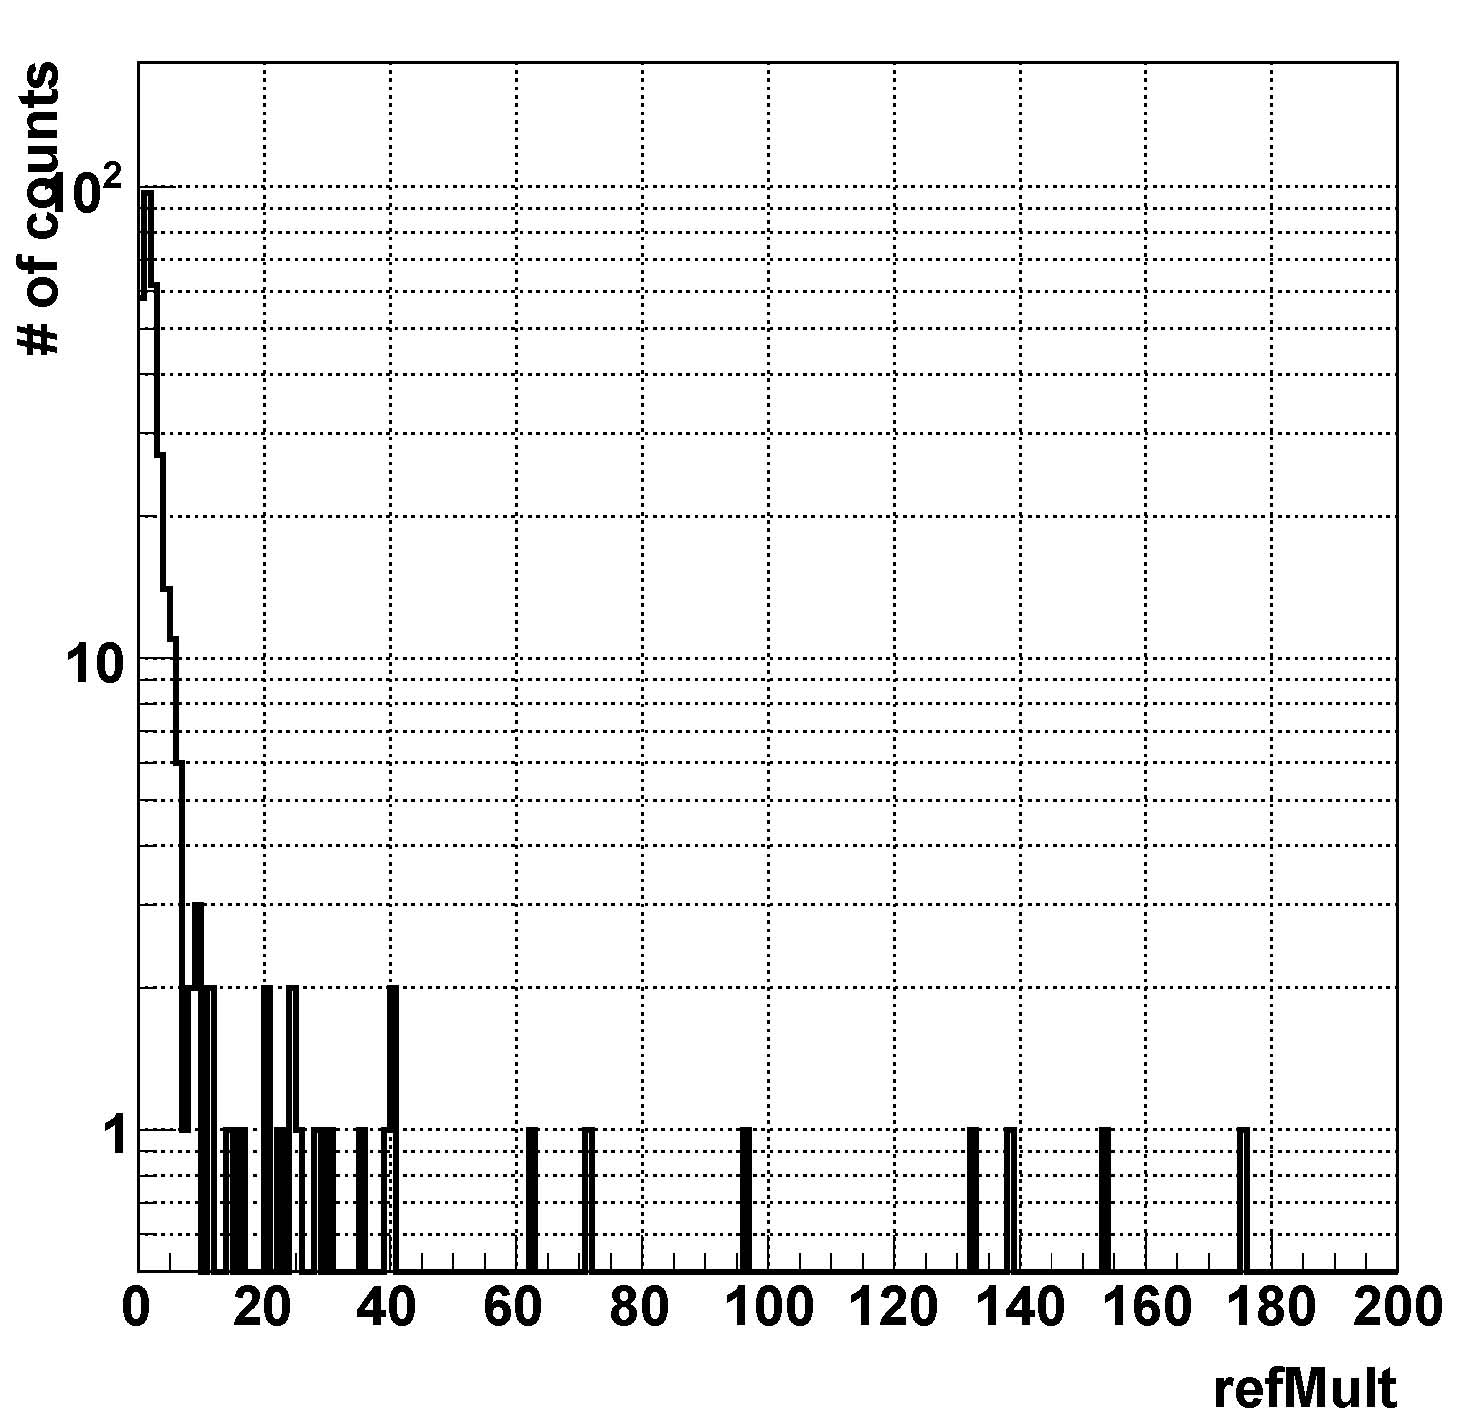 |
 |
 |
| 3,3,2 | 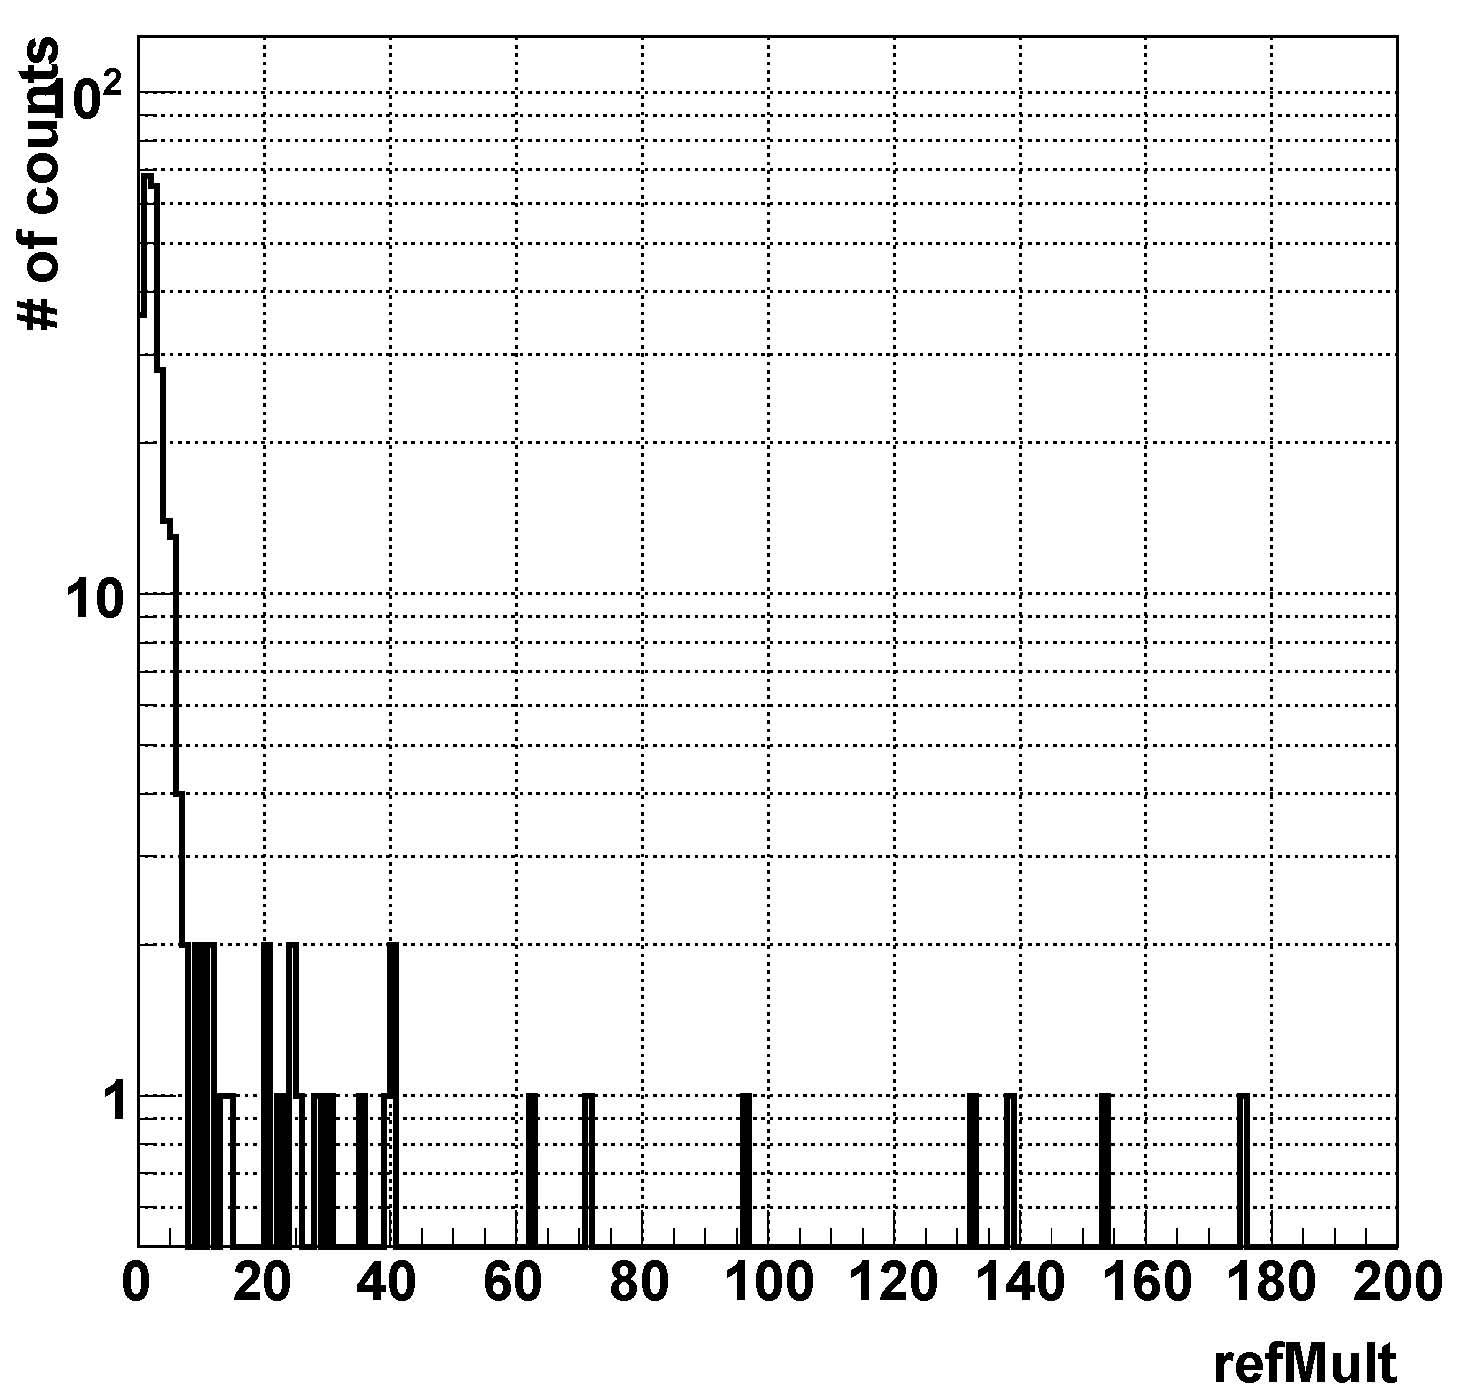 |
 |
 |
| 6,6,2 | .jpg) |
 |
 |
| 6,6,5 | 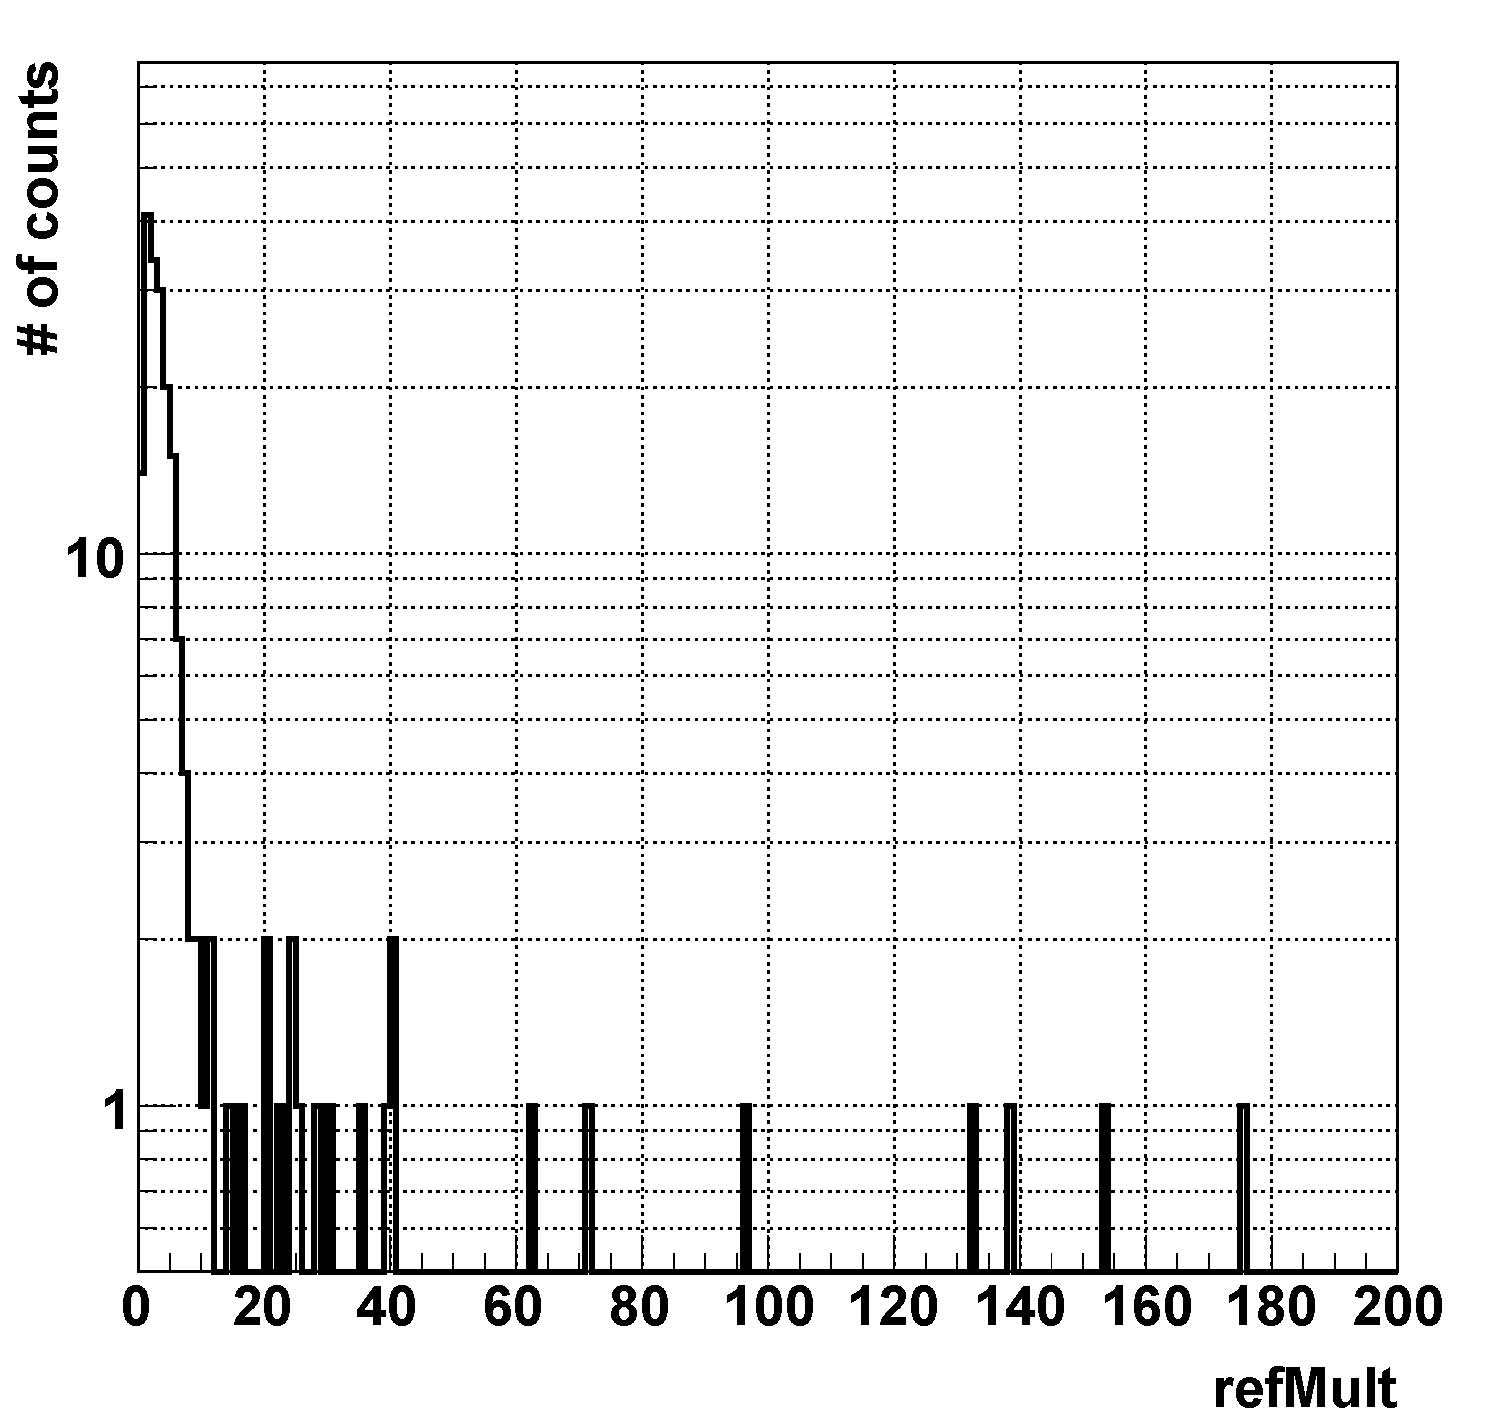 |
 |
 |
| Alex's Finder | |||
| Glauber | 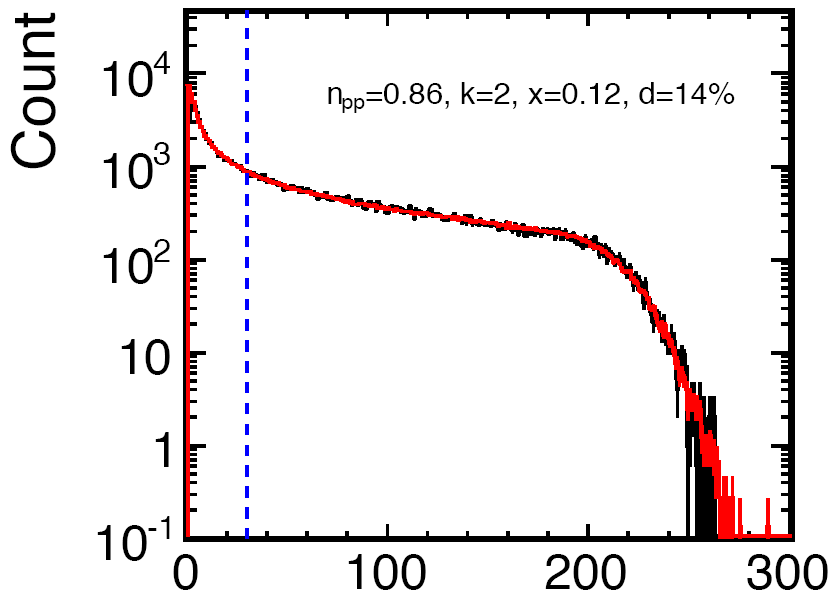 |
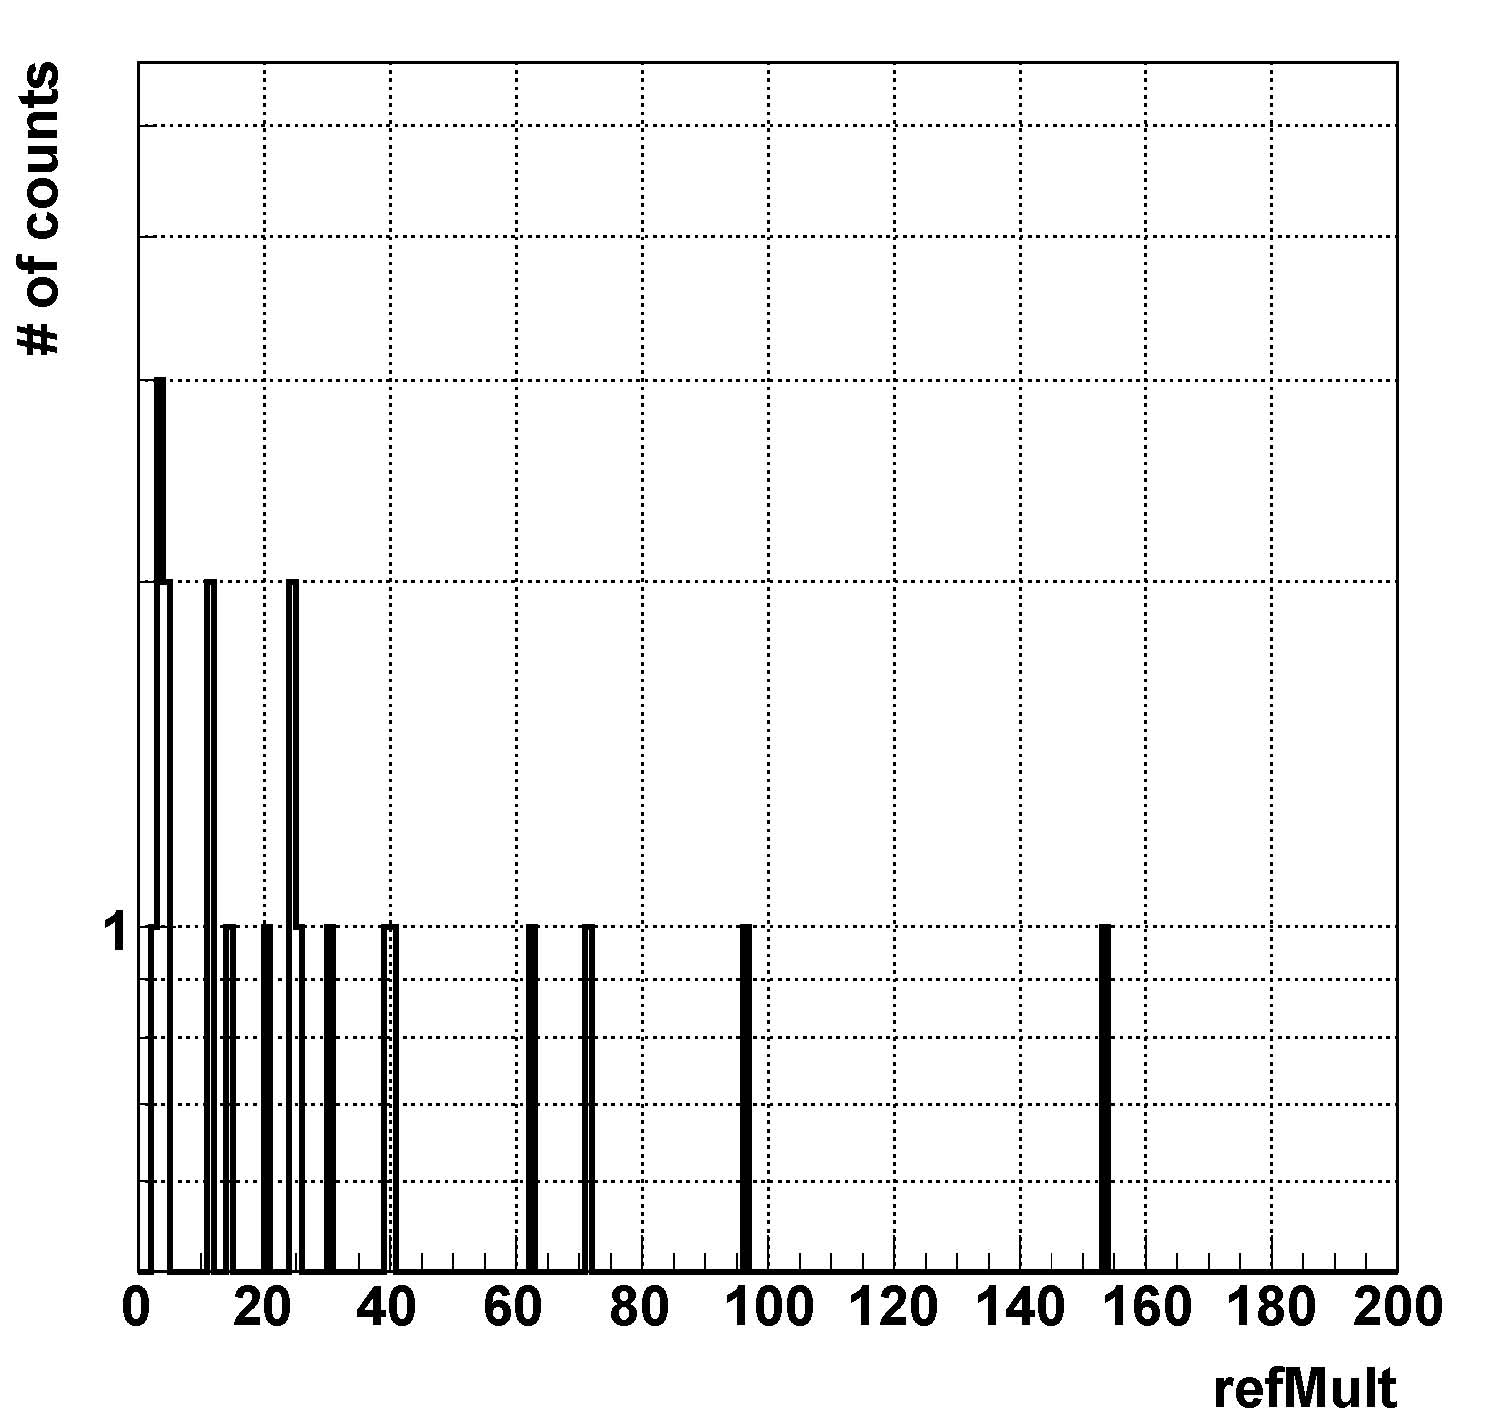
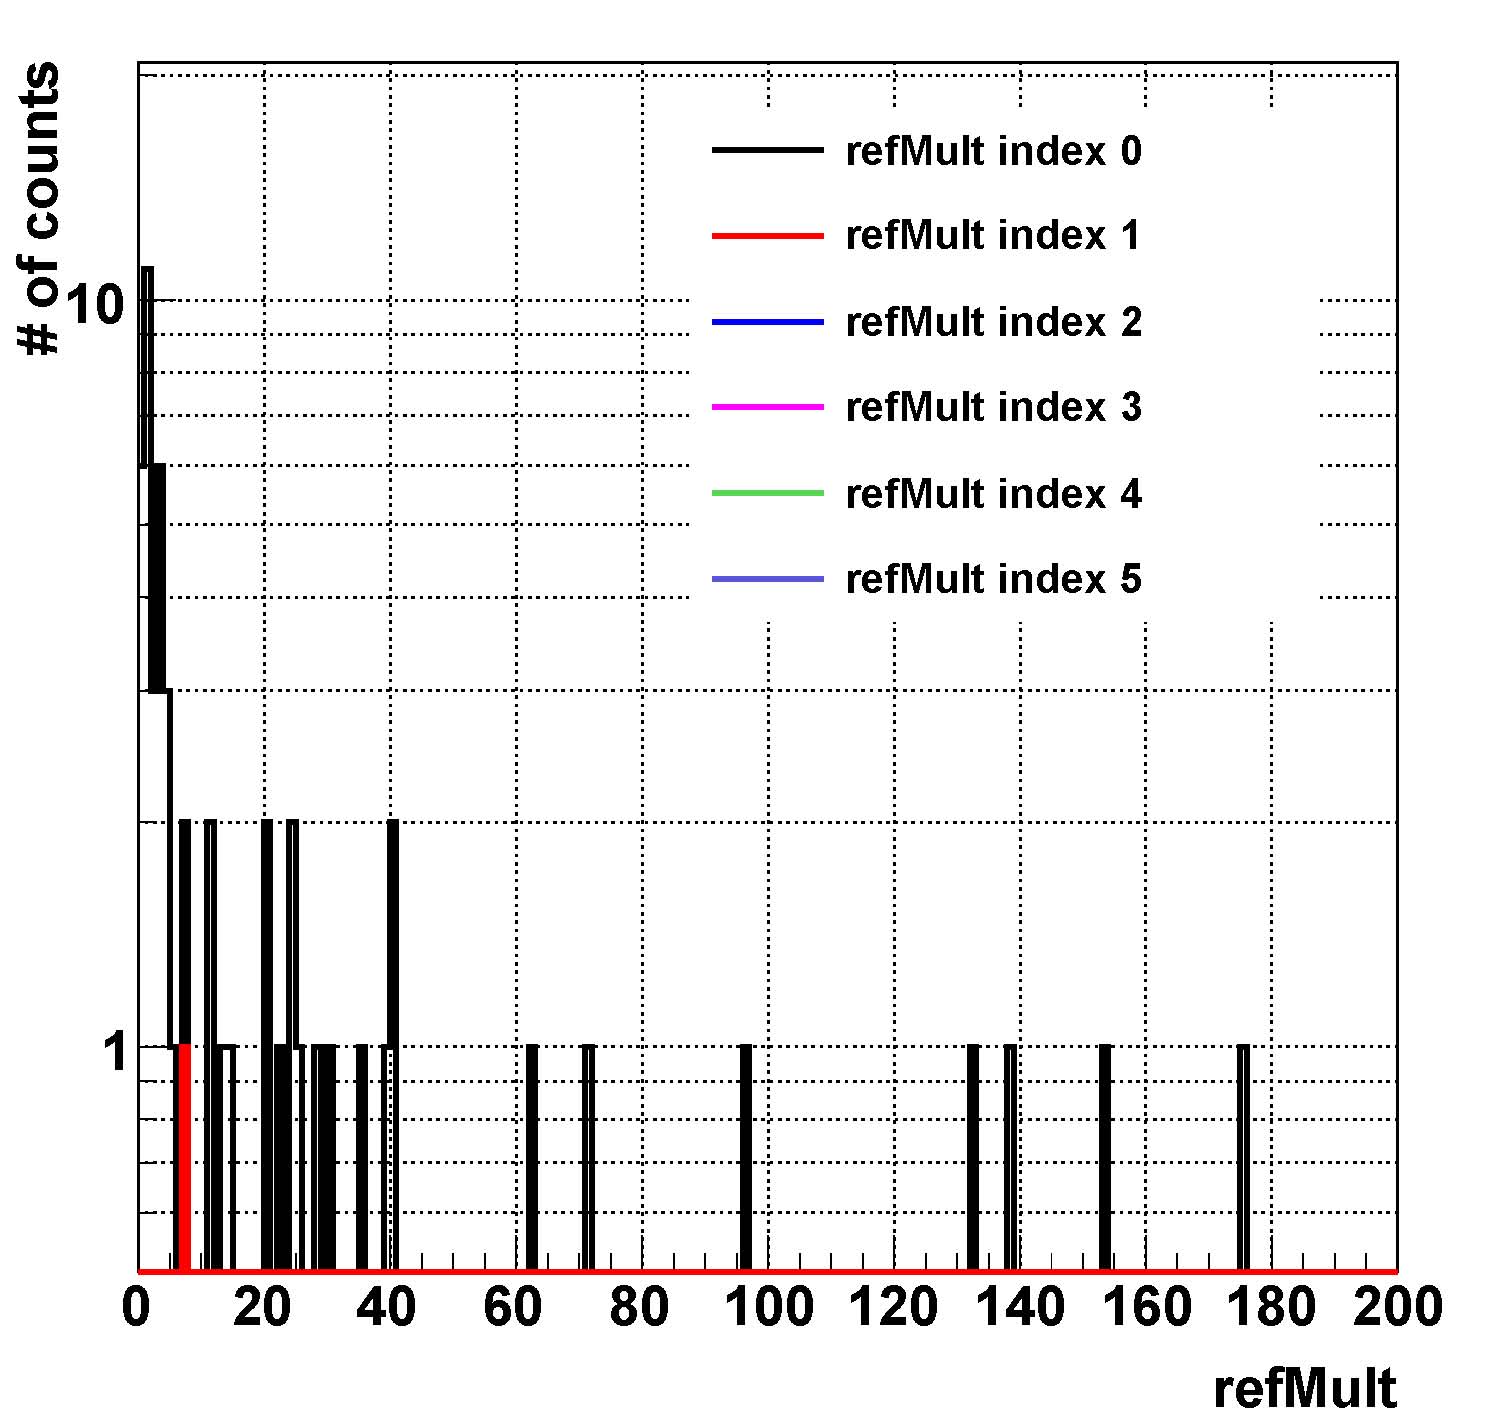
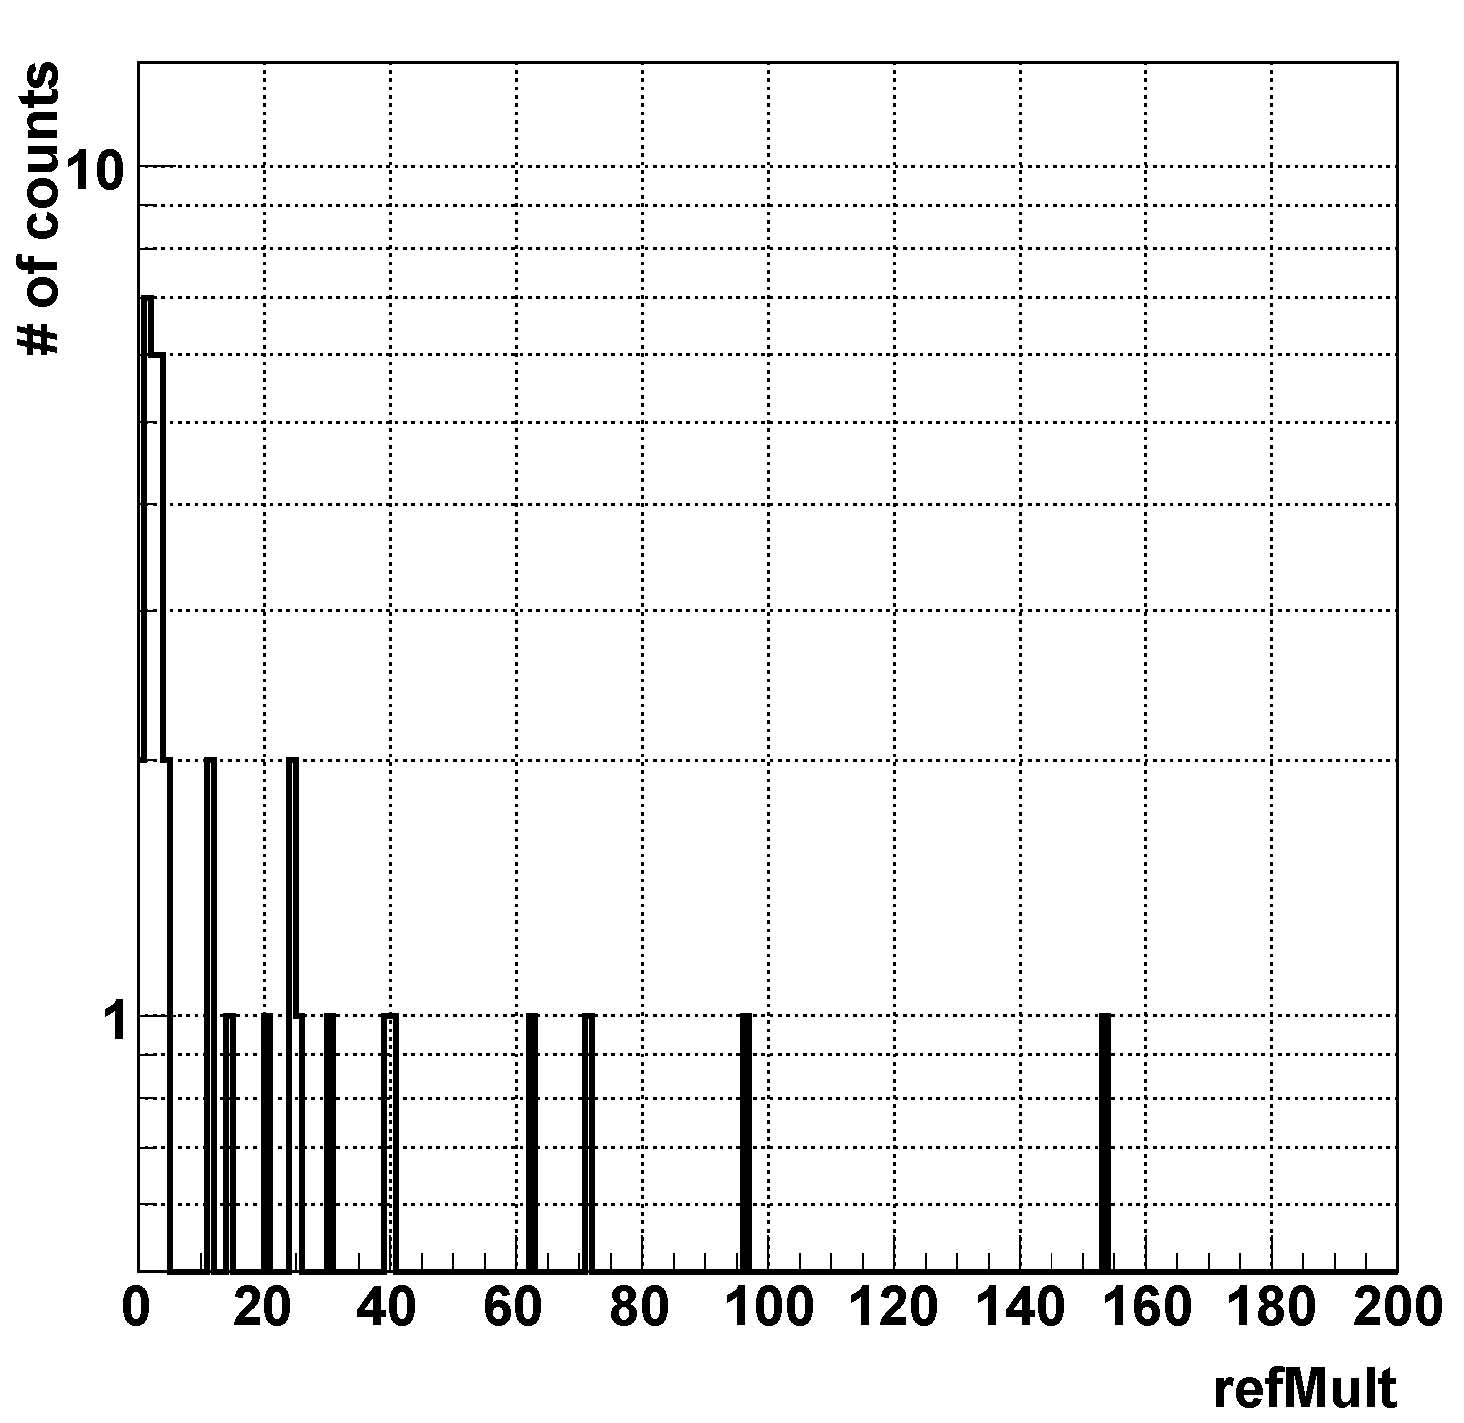
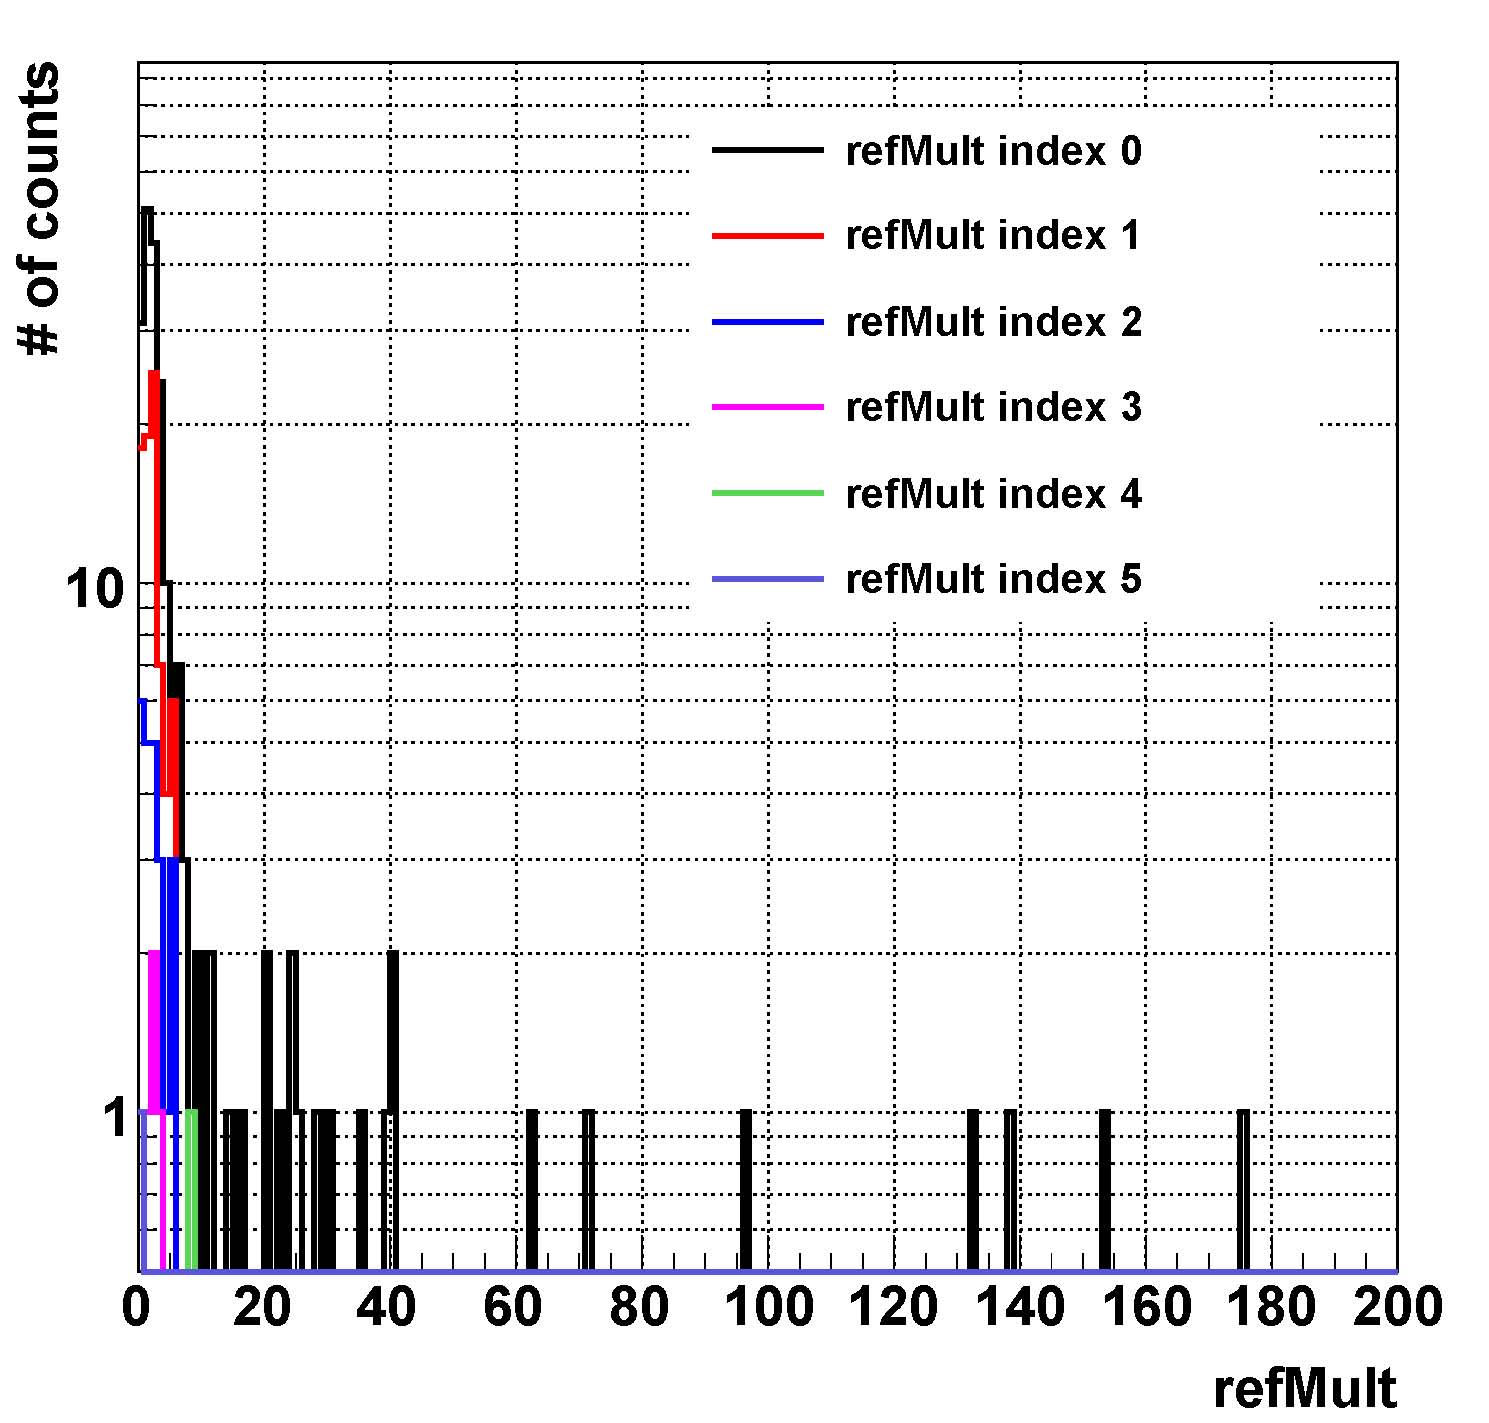
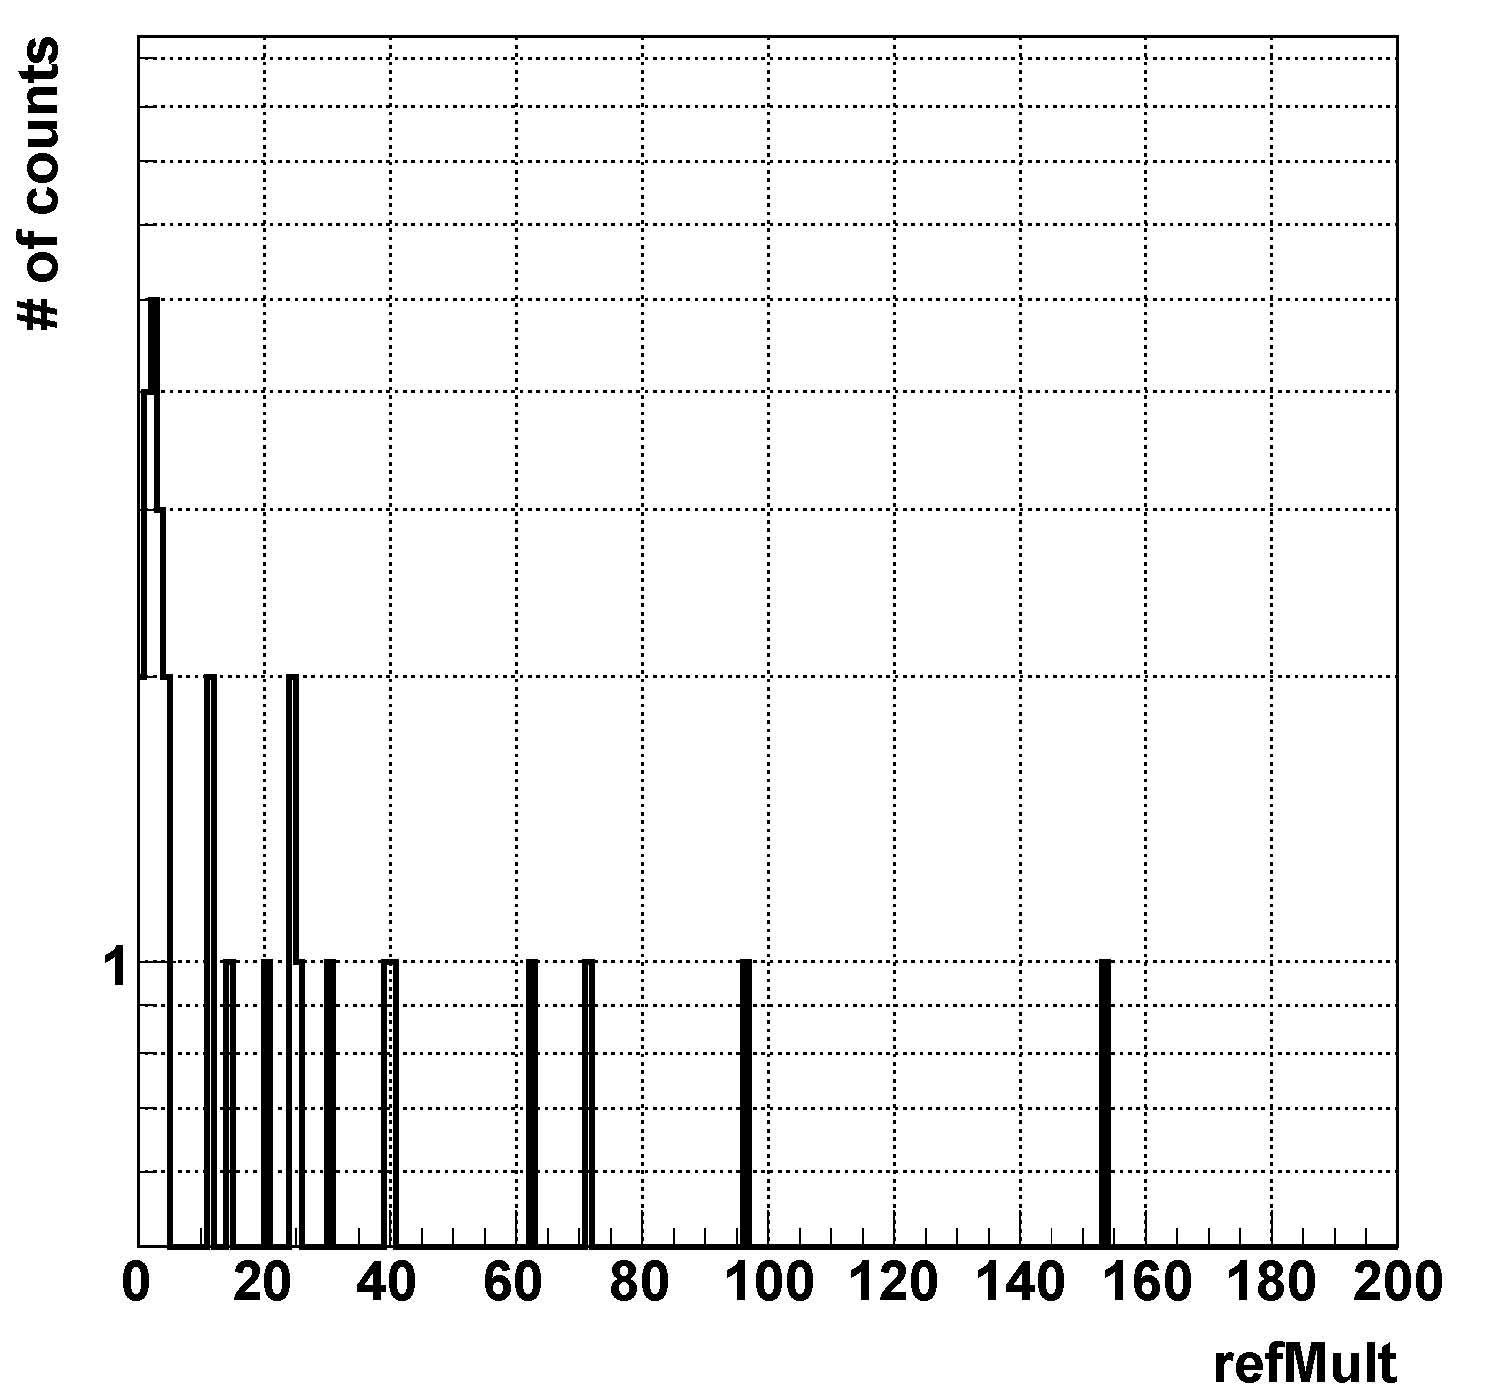
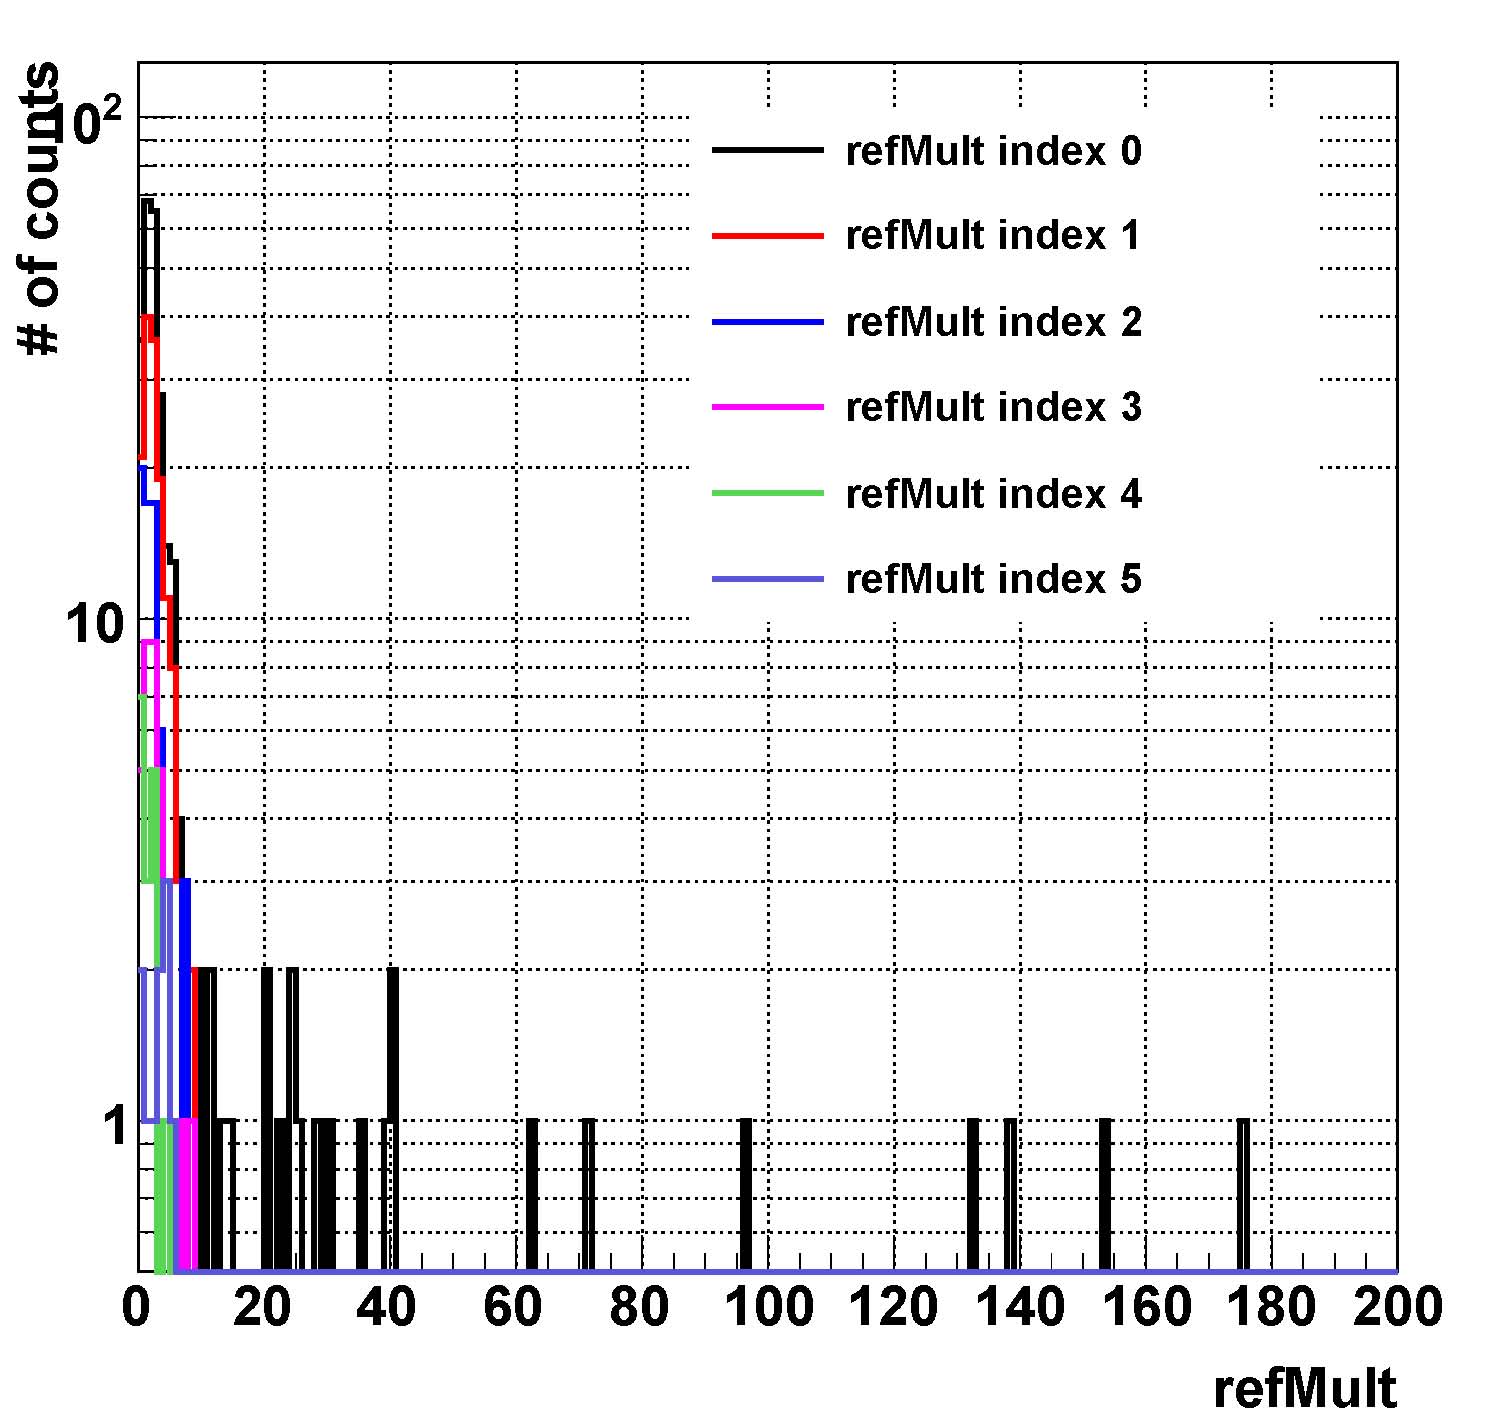
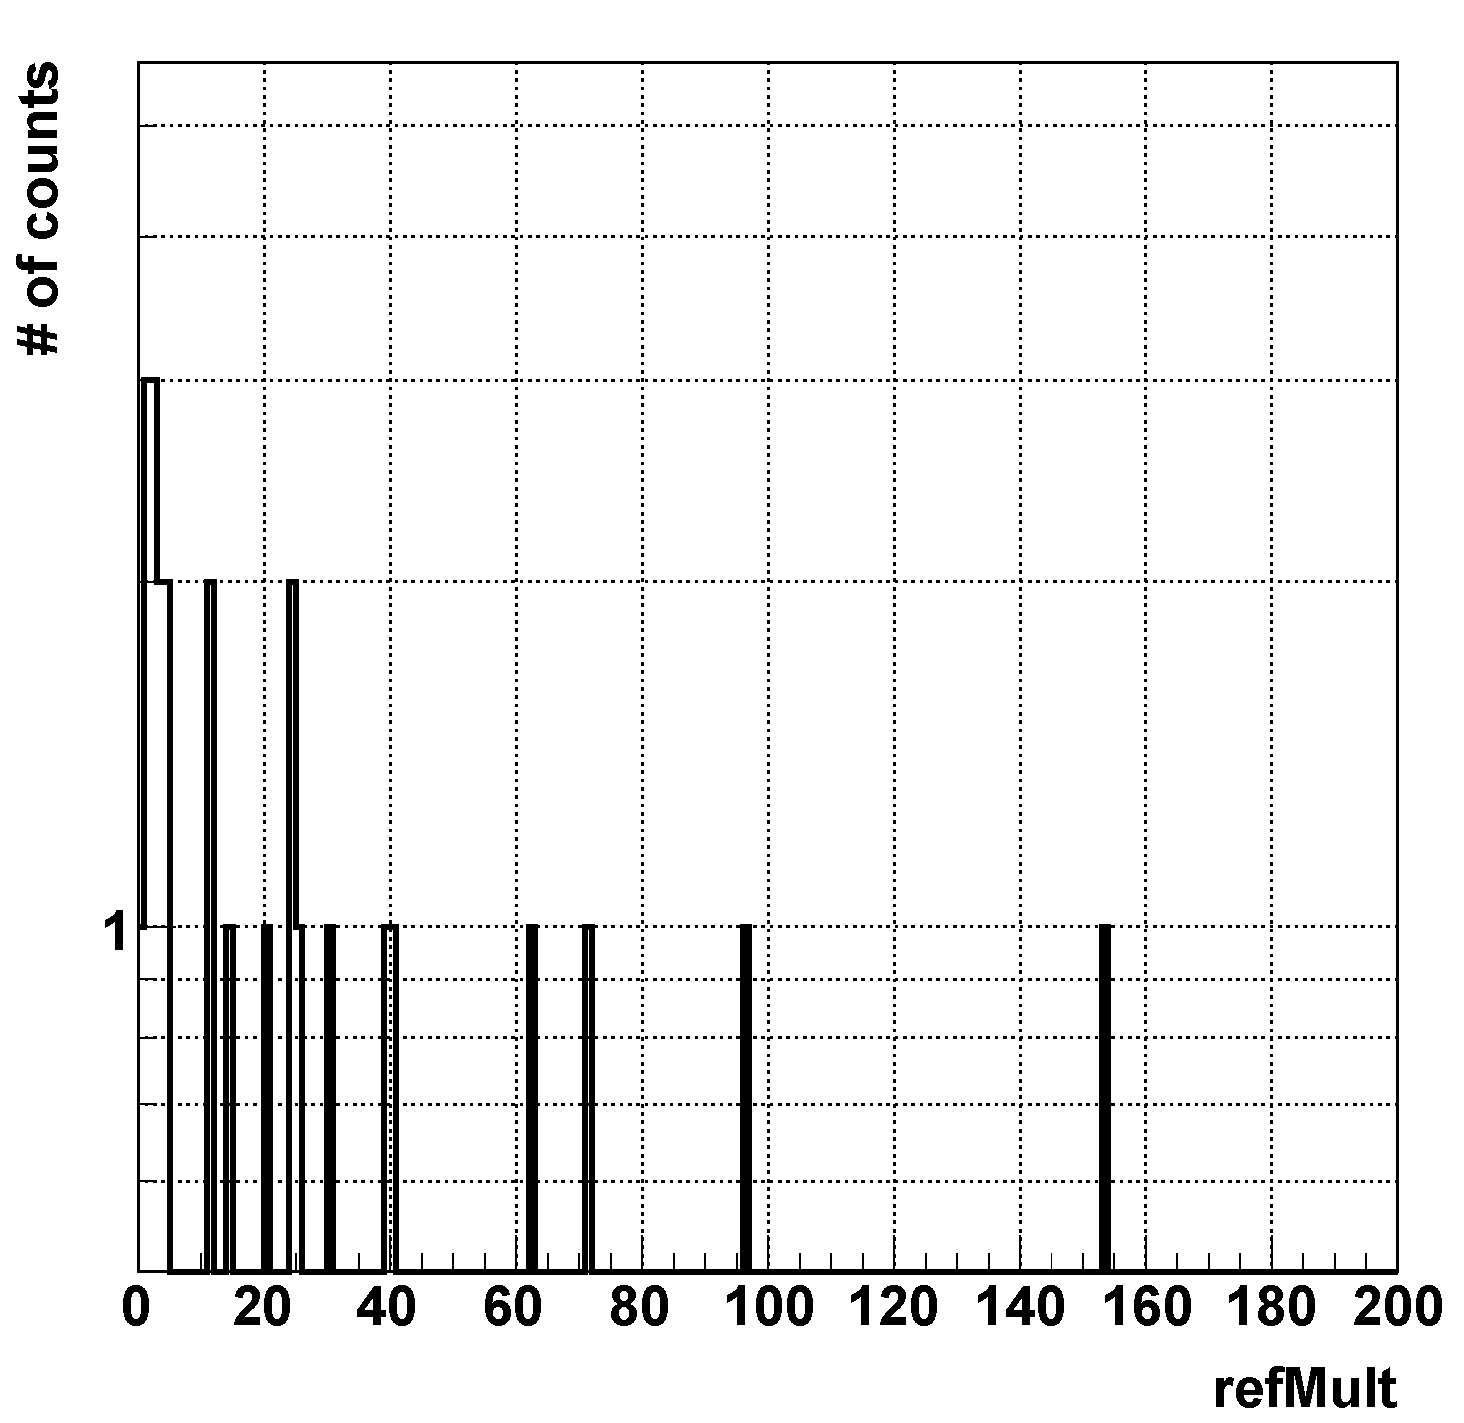
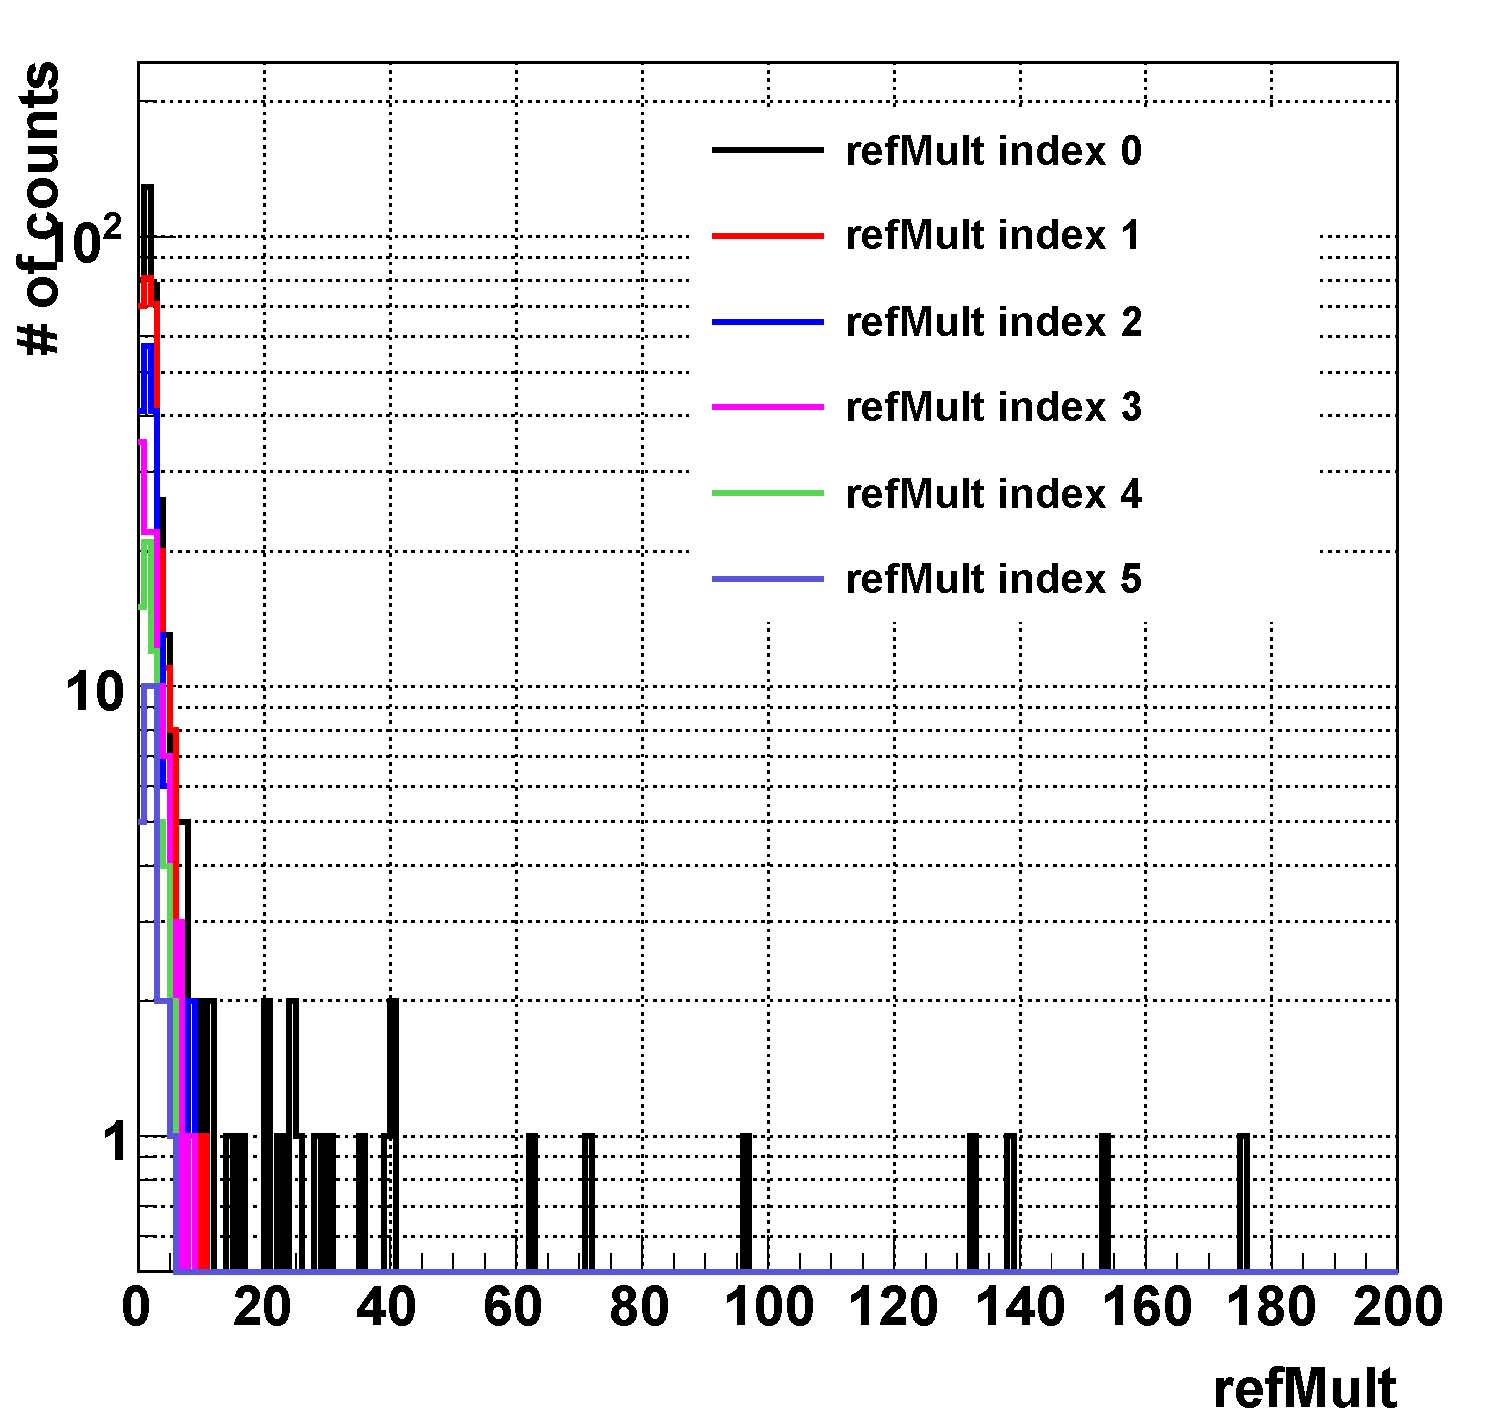
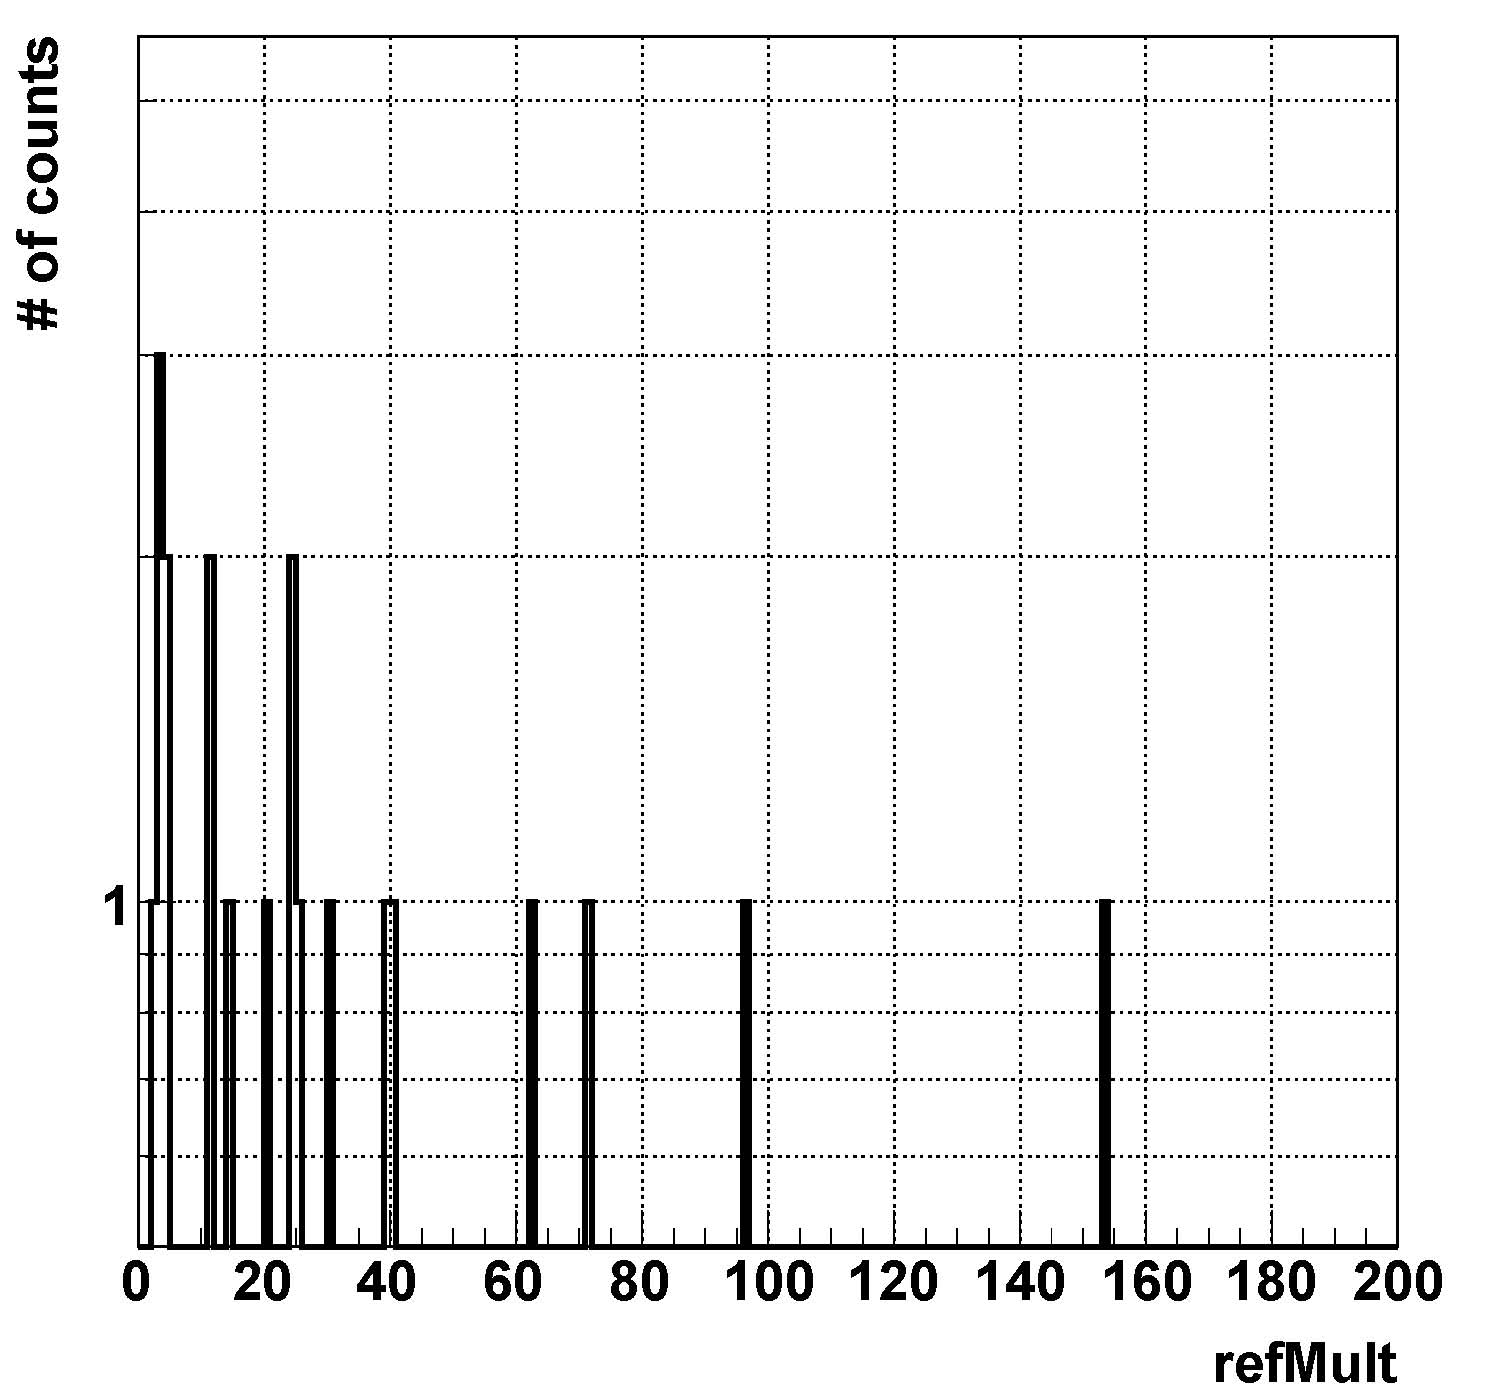
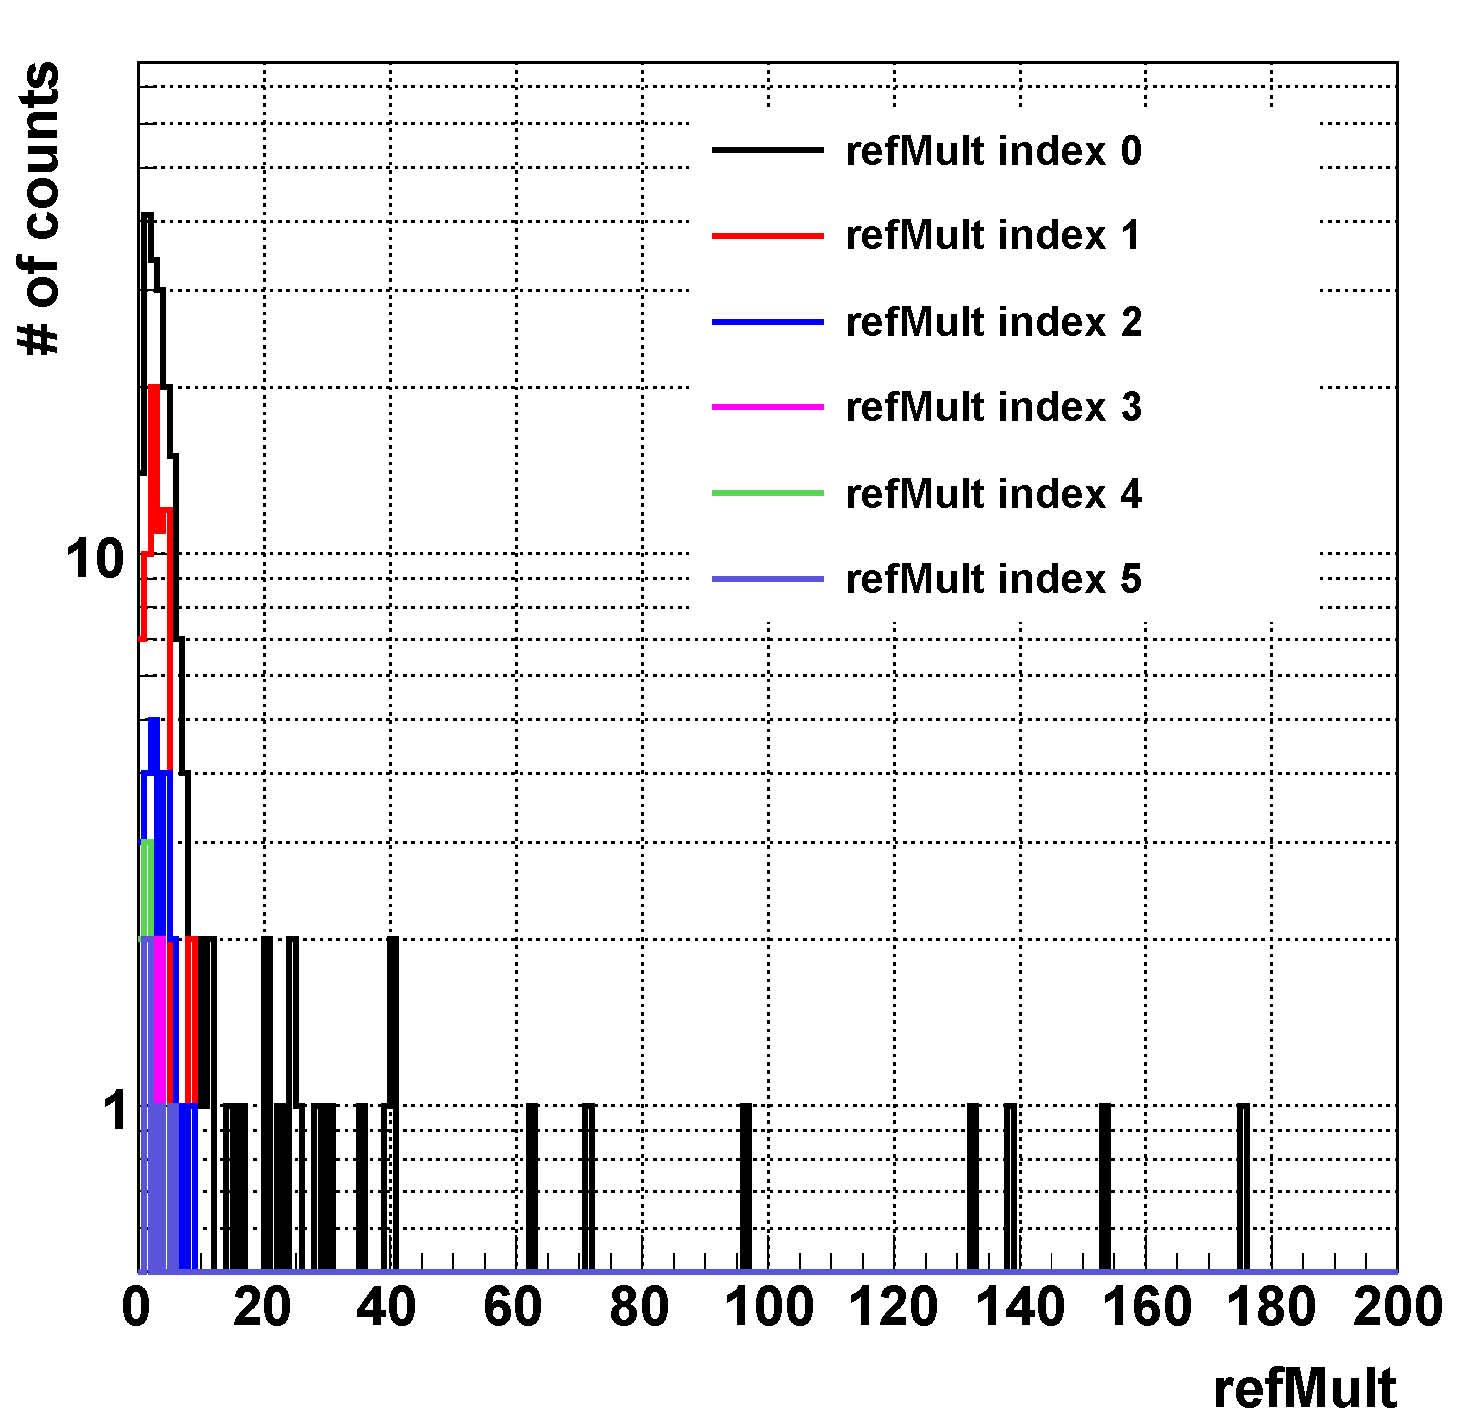
Table 3: RefMult Distributions
| Scenerio (R, Z, N) | graph | fit |
| 1.5,3,5 (default) | 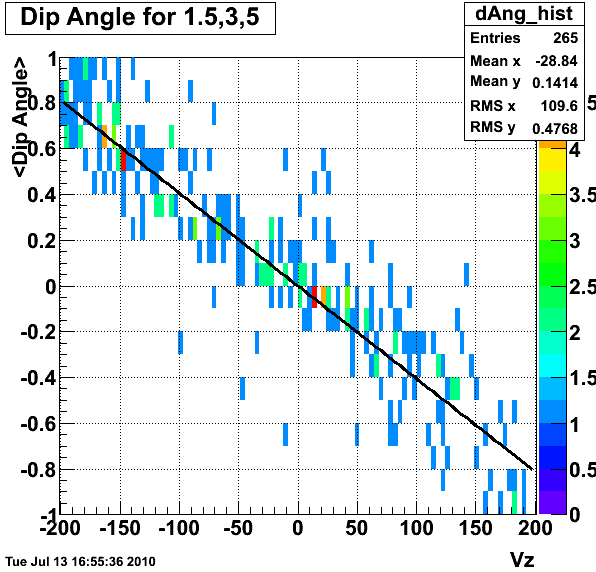 |
-4.06e-3 \pm 6.36e-5 |
| 1.5,6,2 | 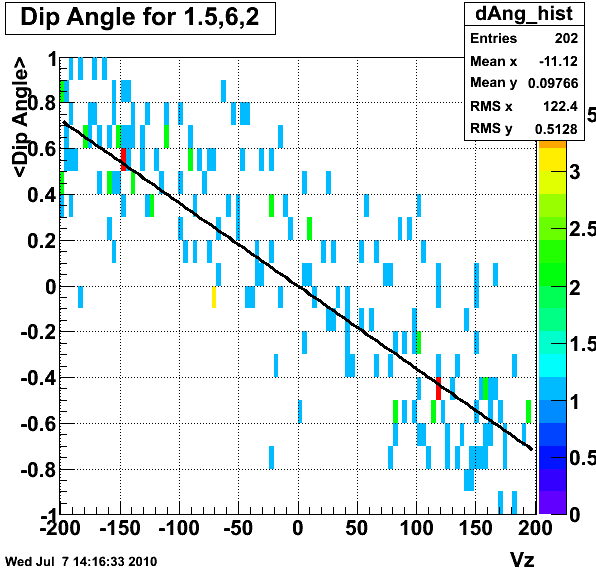 |
-3.62E-3 \pm 6.52E-5 |
| 3,6,2 | 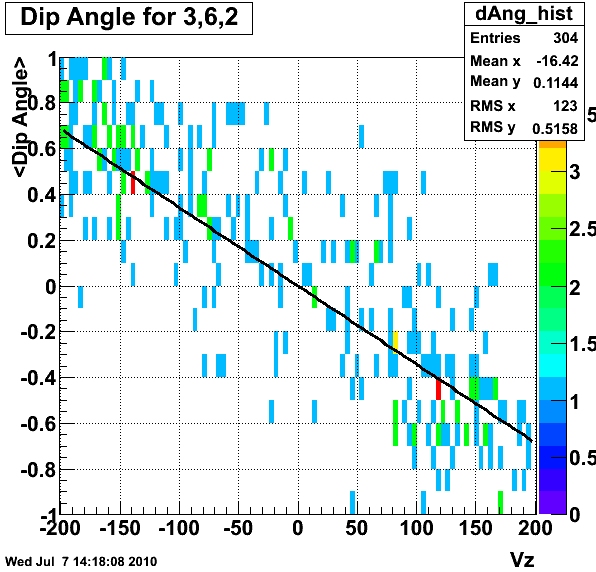 |
-3.43E-3 \pm 5.57E-5 |
| 3,3,2 | 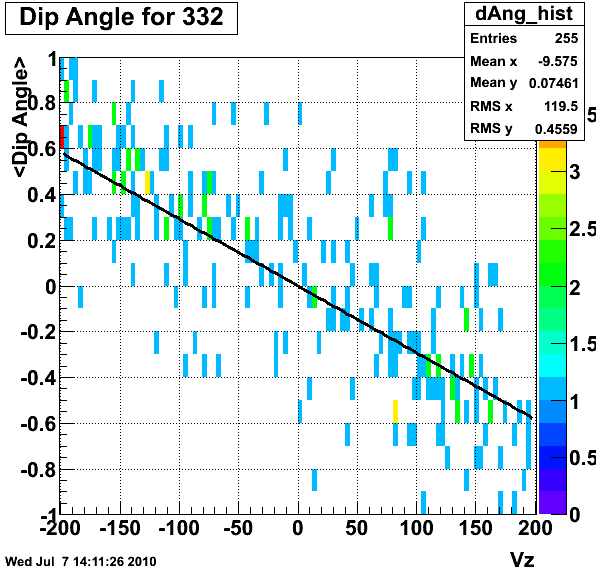 |
-2.92E-3 \pm 5.90E-5 |
| 6,6,2 | 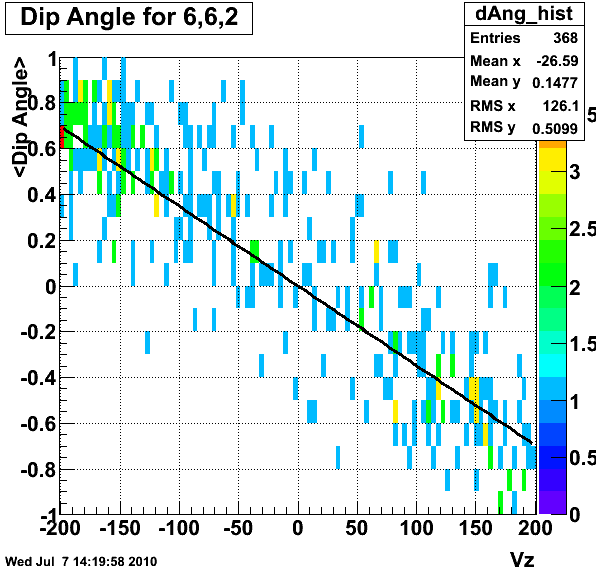 |
-3.48E-3 \pm 5.21E-5 |
| 6,6,5 | 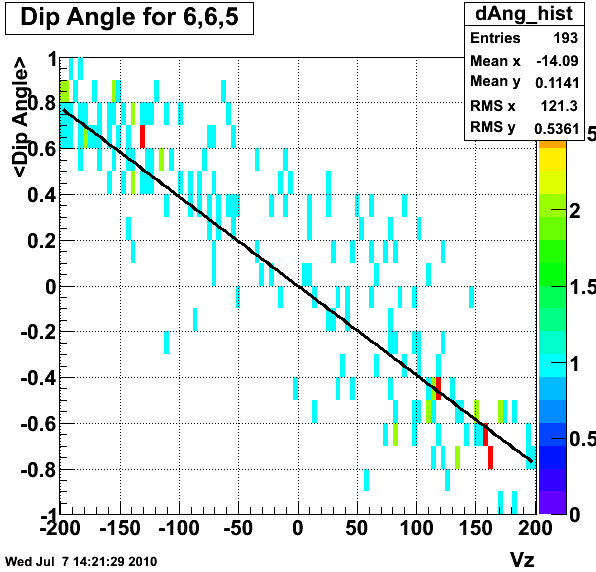 |
-3.90E-3 \pm 6.77E-5 |
Table 4: dip angle distributions. Note that the errors quoted here are just from minuit fitting. We haven't been careful to propagate the true error yet.
| Options | Plot | Fit Parameters |
| 1.5,3,5 | 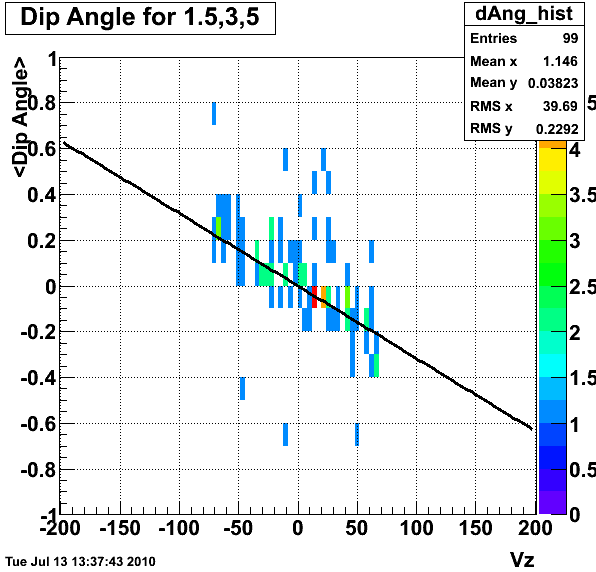 |
-3.17e-3 \pm 2.94e-4 |
| 1.5,6,2 | 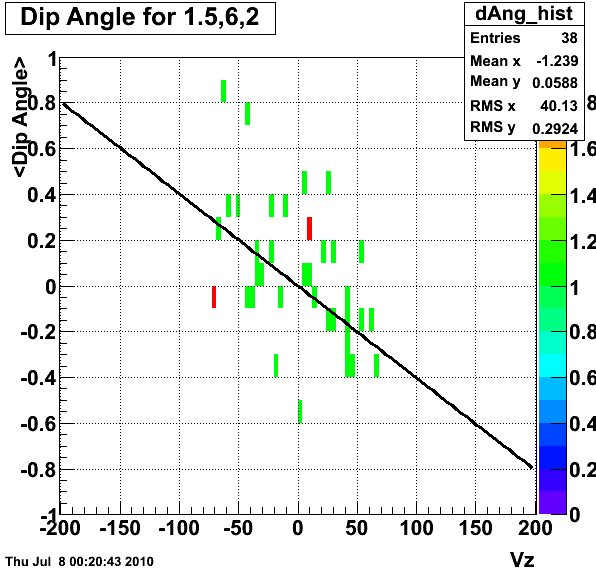 |
-4.02484e-03 \pm 4.29994e-04 |
| 3,6,2 | 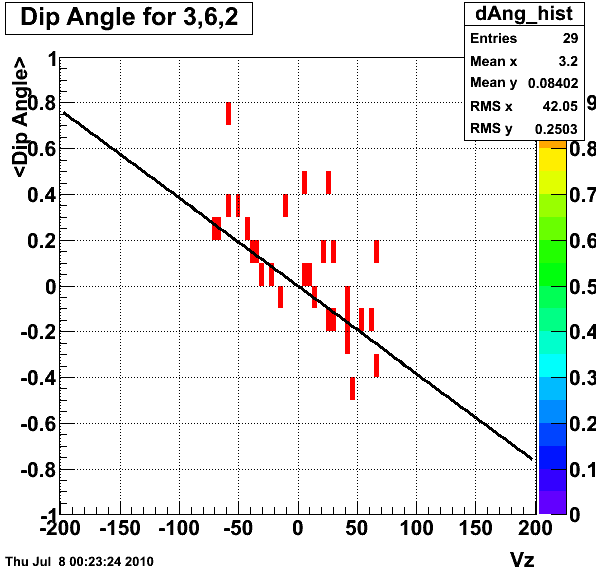 |
-4.02484e-03 \pm 4.29994e-04 |
| 3,3,2 | 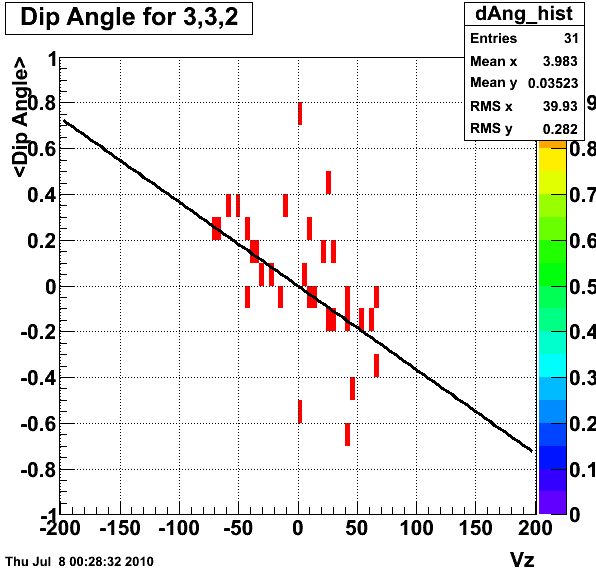 |
-3.66023e-03 \pm 4.45506e-04 |
| 6,6,2 | 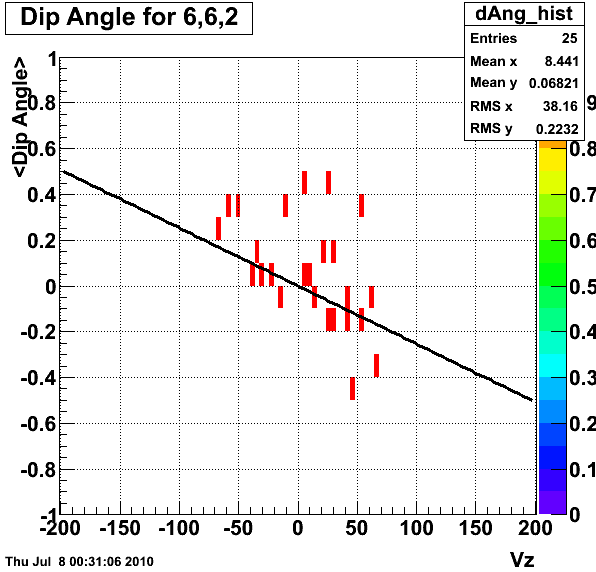 |
-2.53578e-03 \pm 5.09232e-04 |
| 6,6,5 | 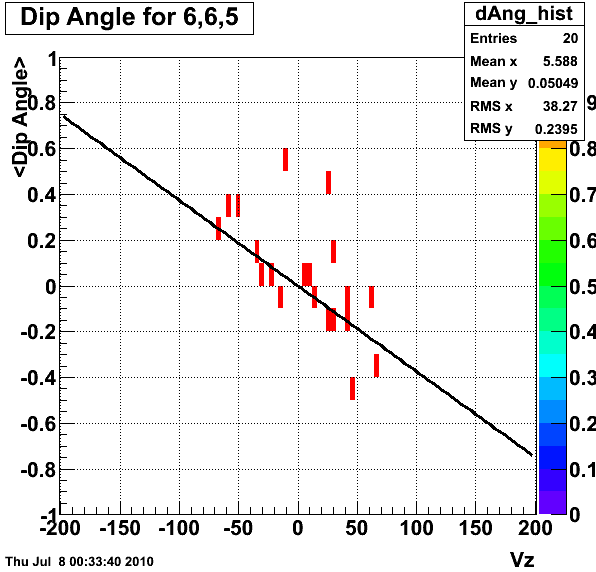 |
-3.73986e-03 \pm 5.70836e-04 |
Table 4b: dip angle distributions with |Vz|<70 cm and Vr<2 cm
| Scenerio (R, Z, N) | graph | fit |
| 1.5,3,5 (default) | 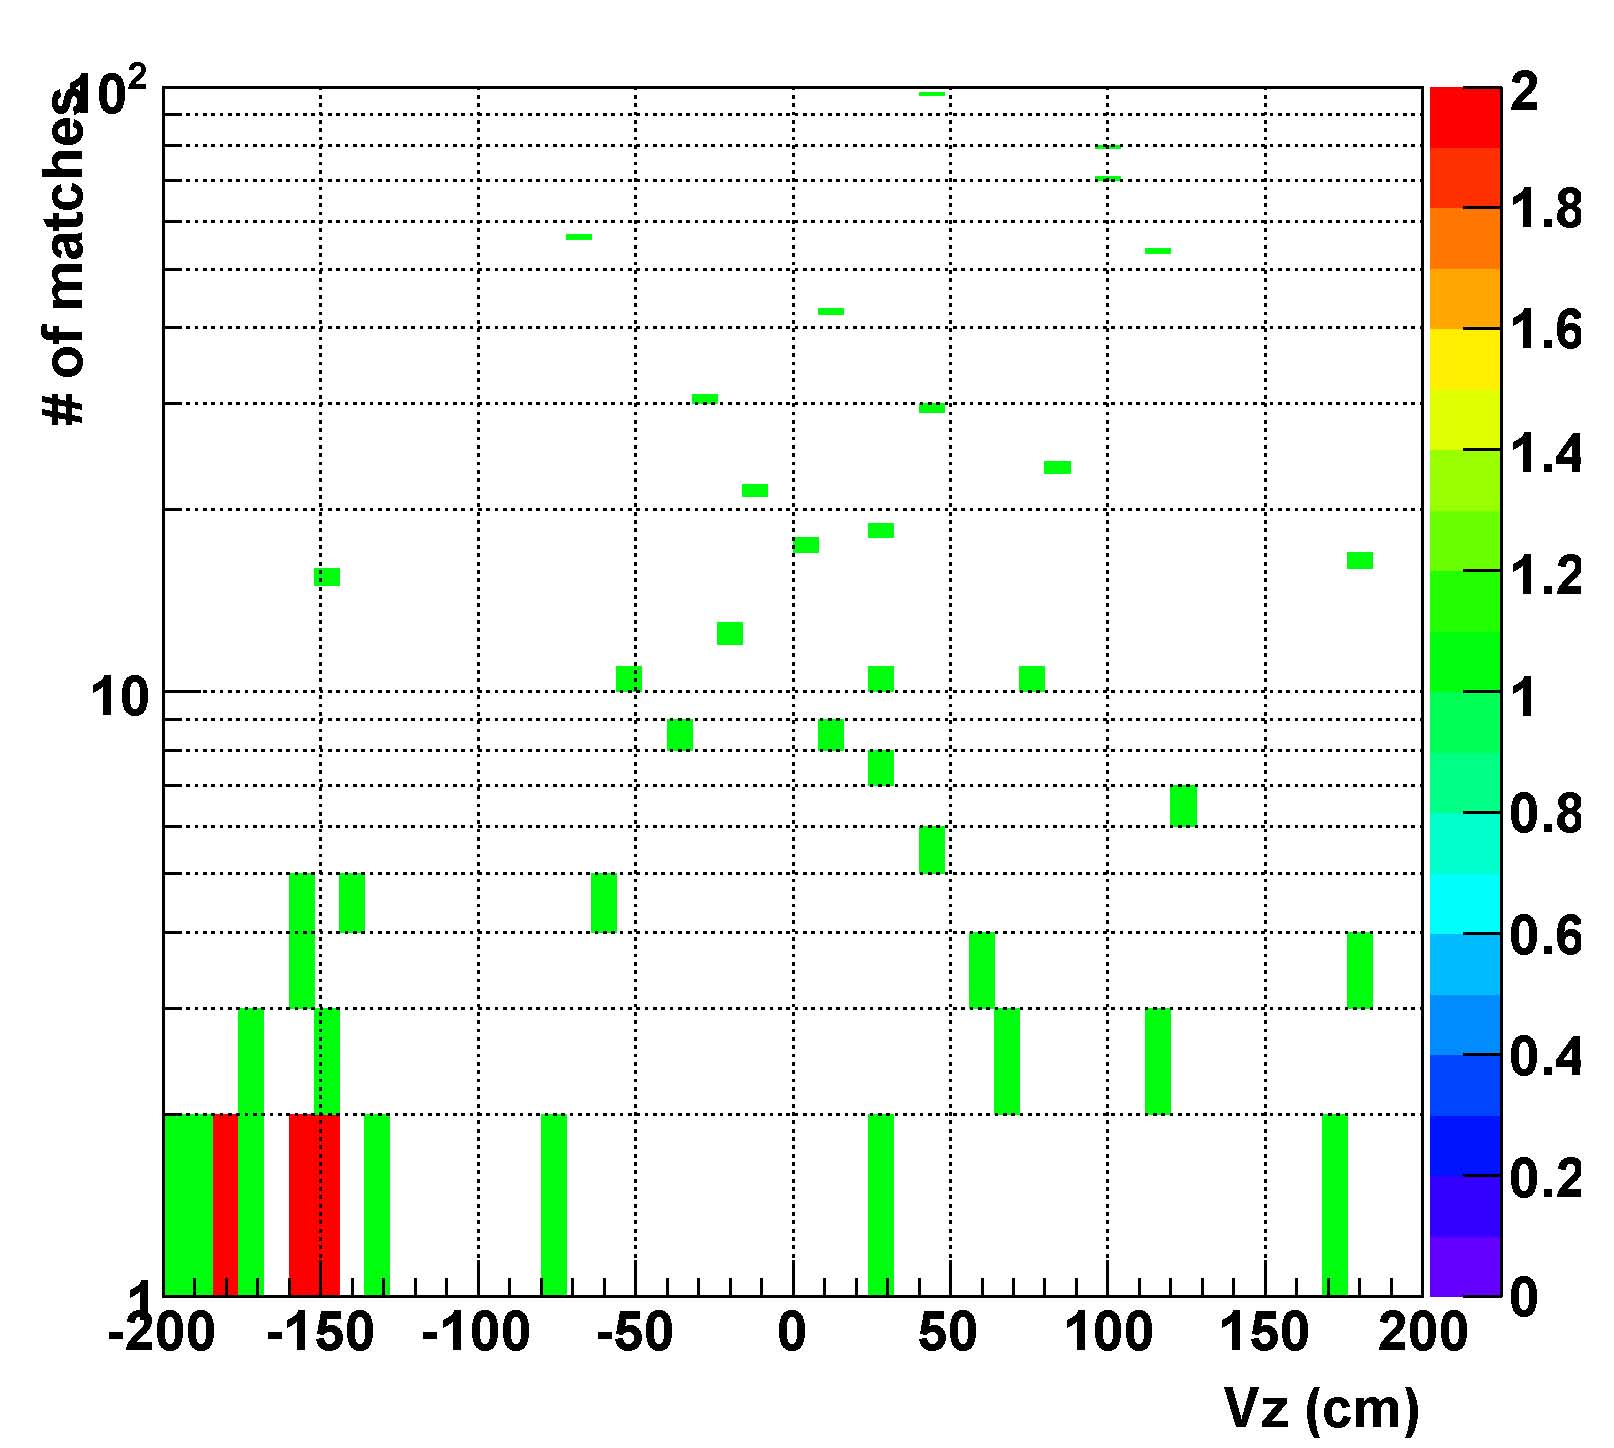 |
|
| 1.5,6,2 | 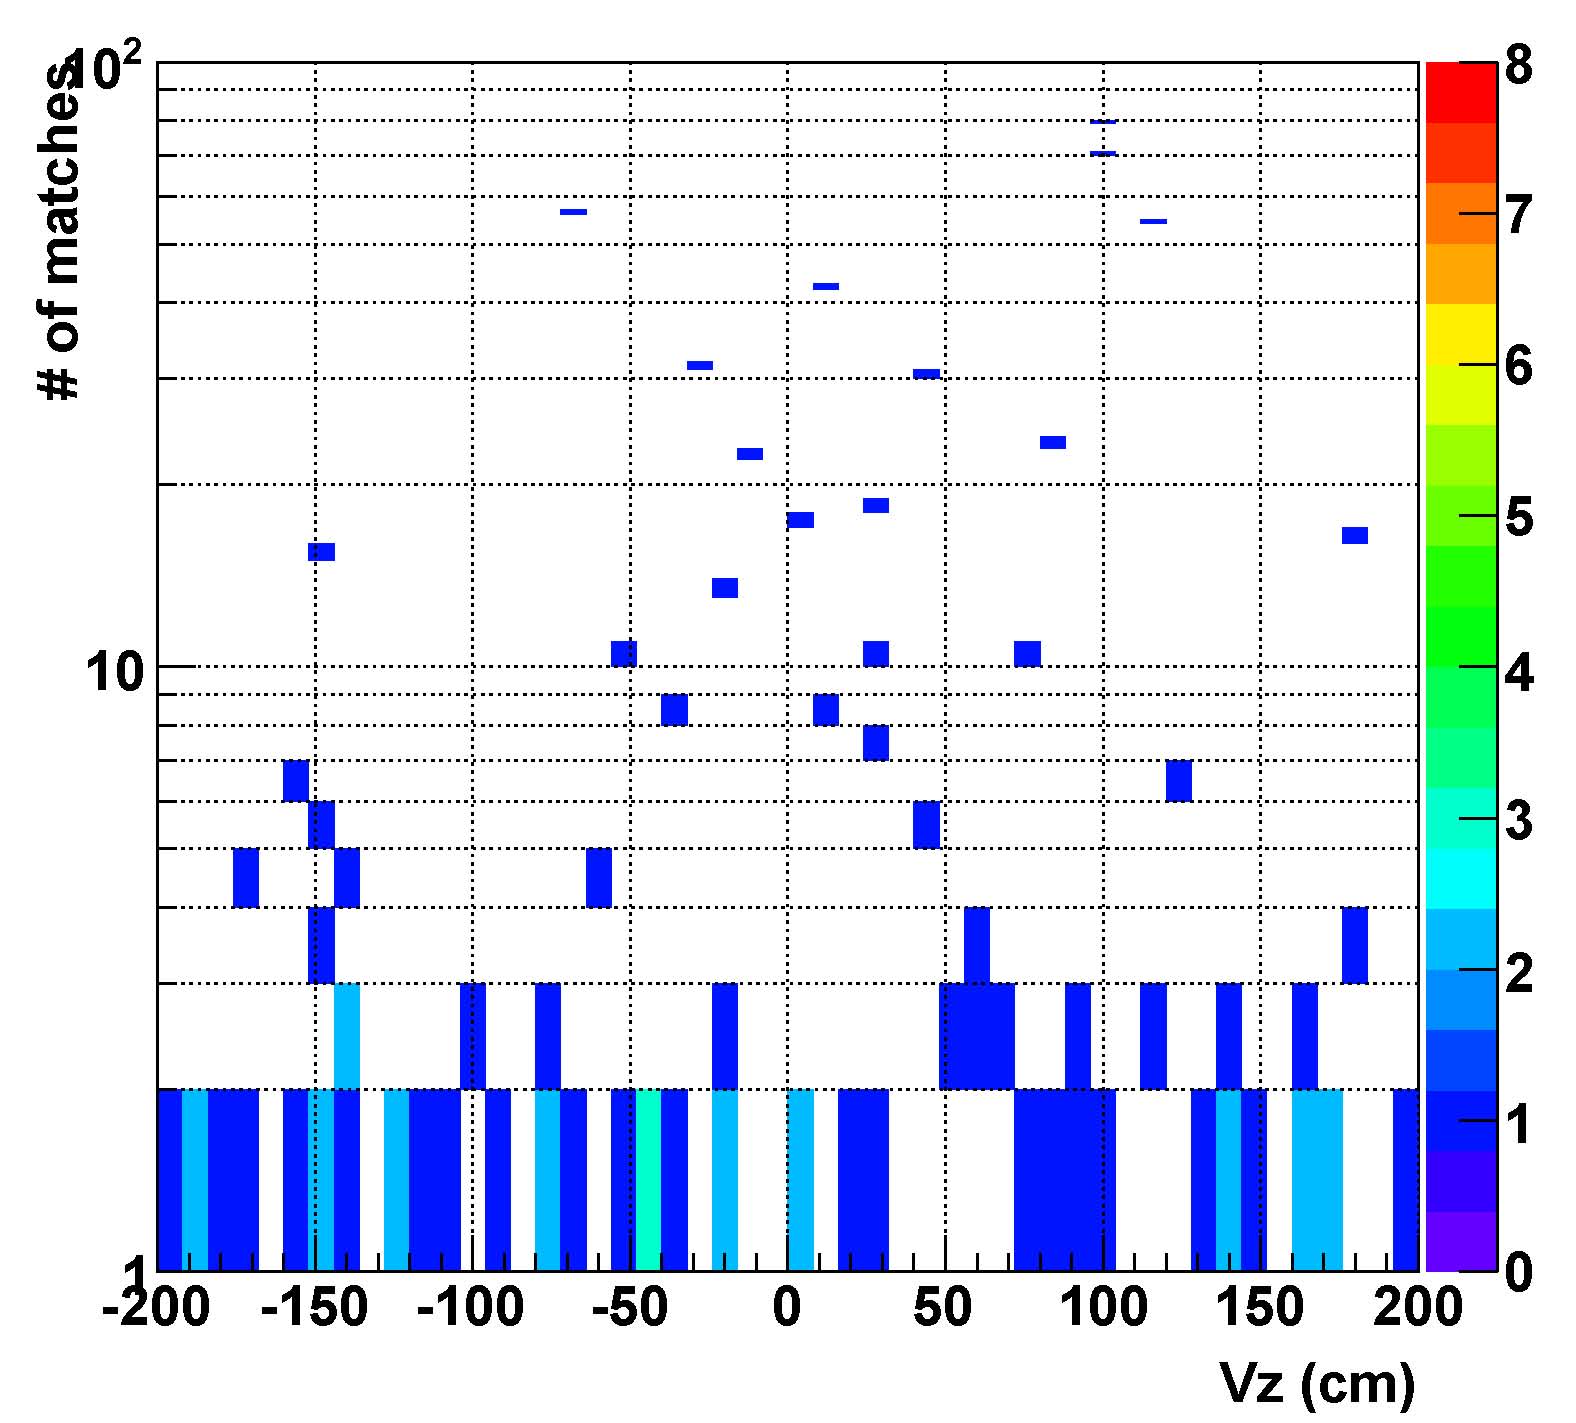 |
|
| 3,6,2 | 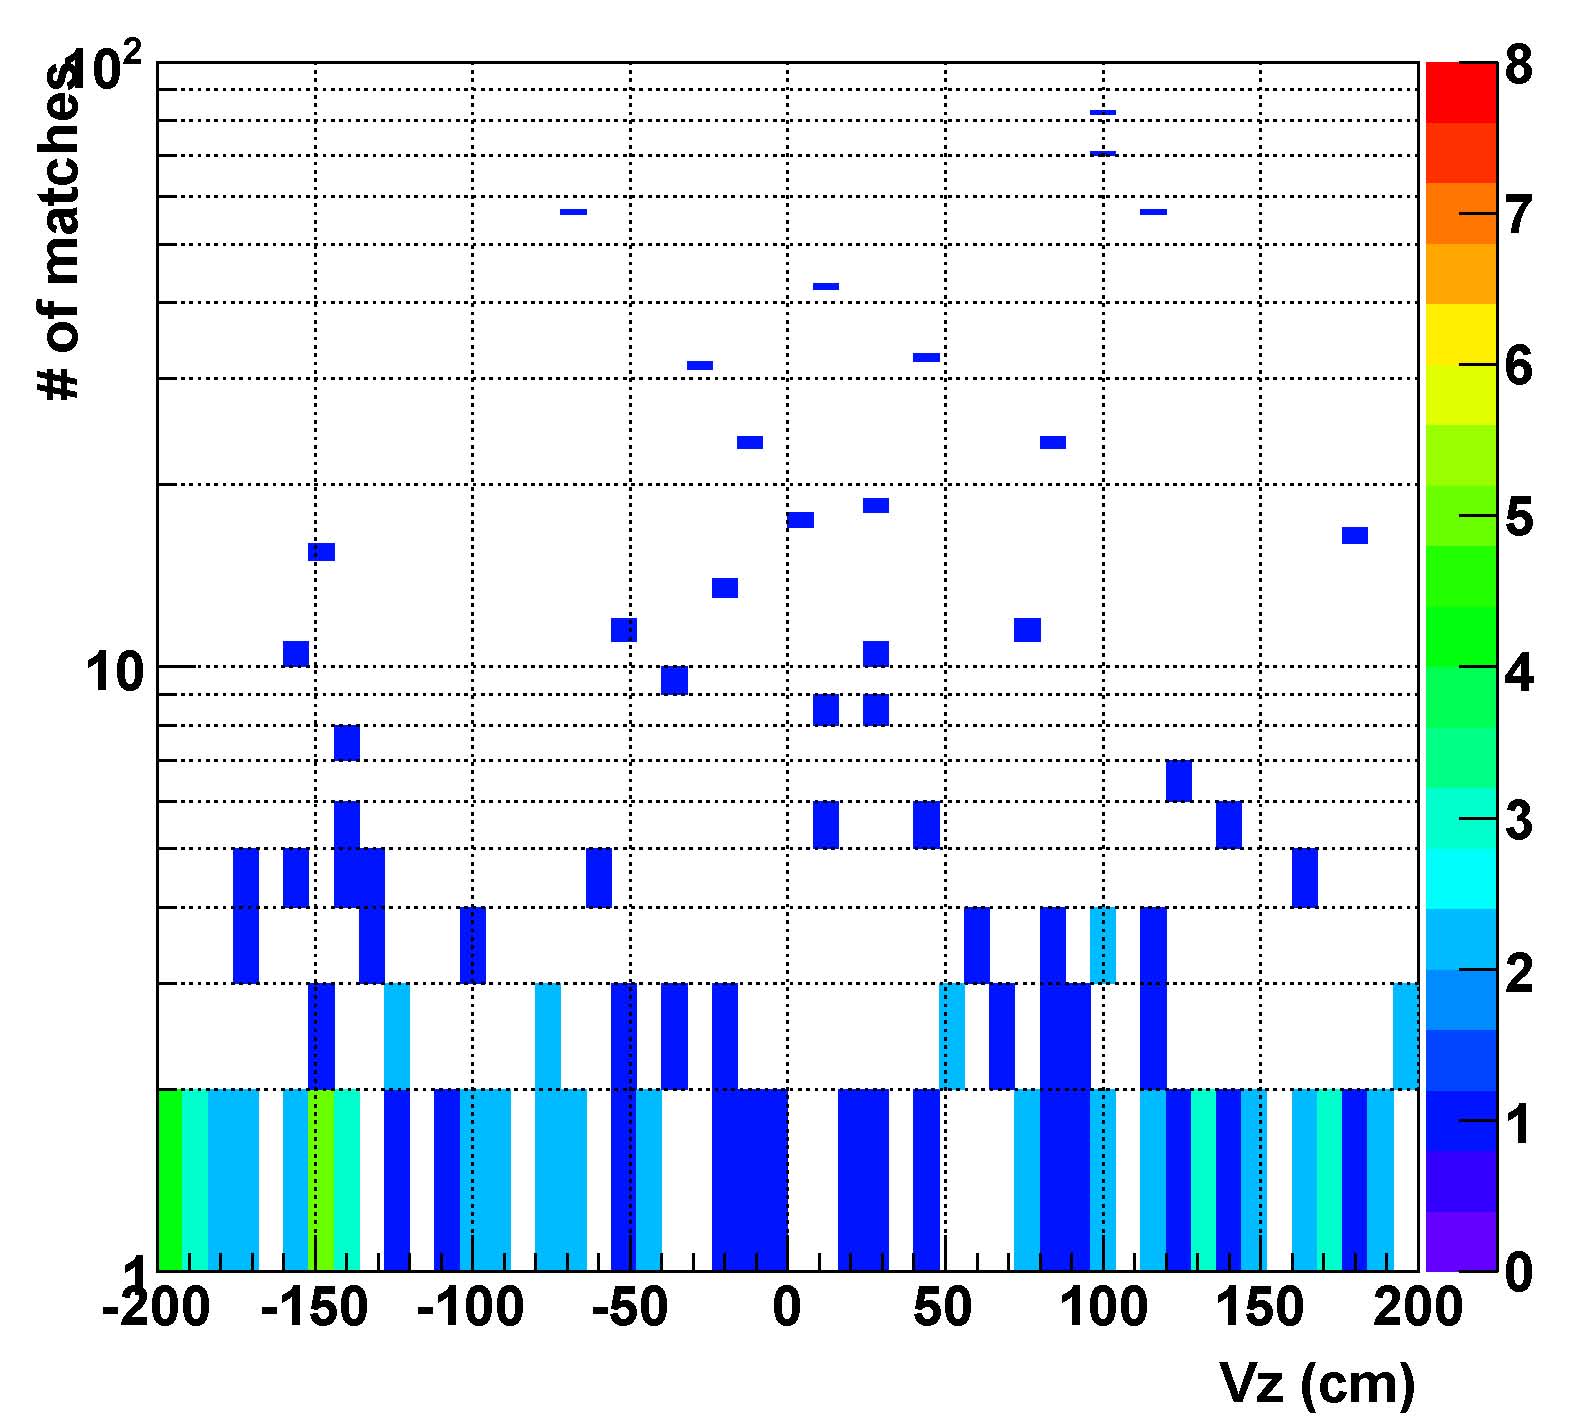 |
|
| 3,3,2 | 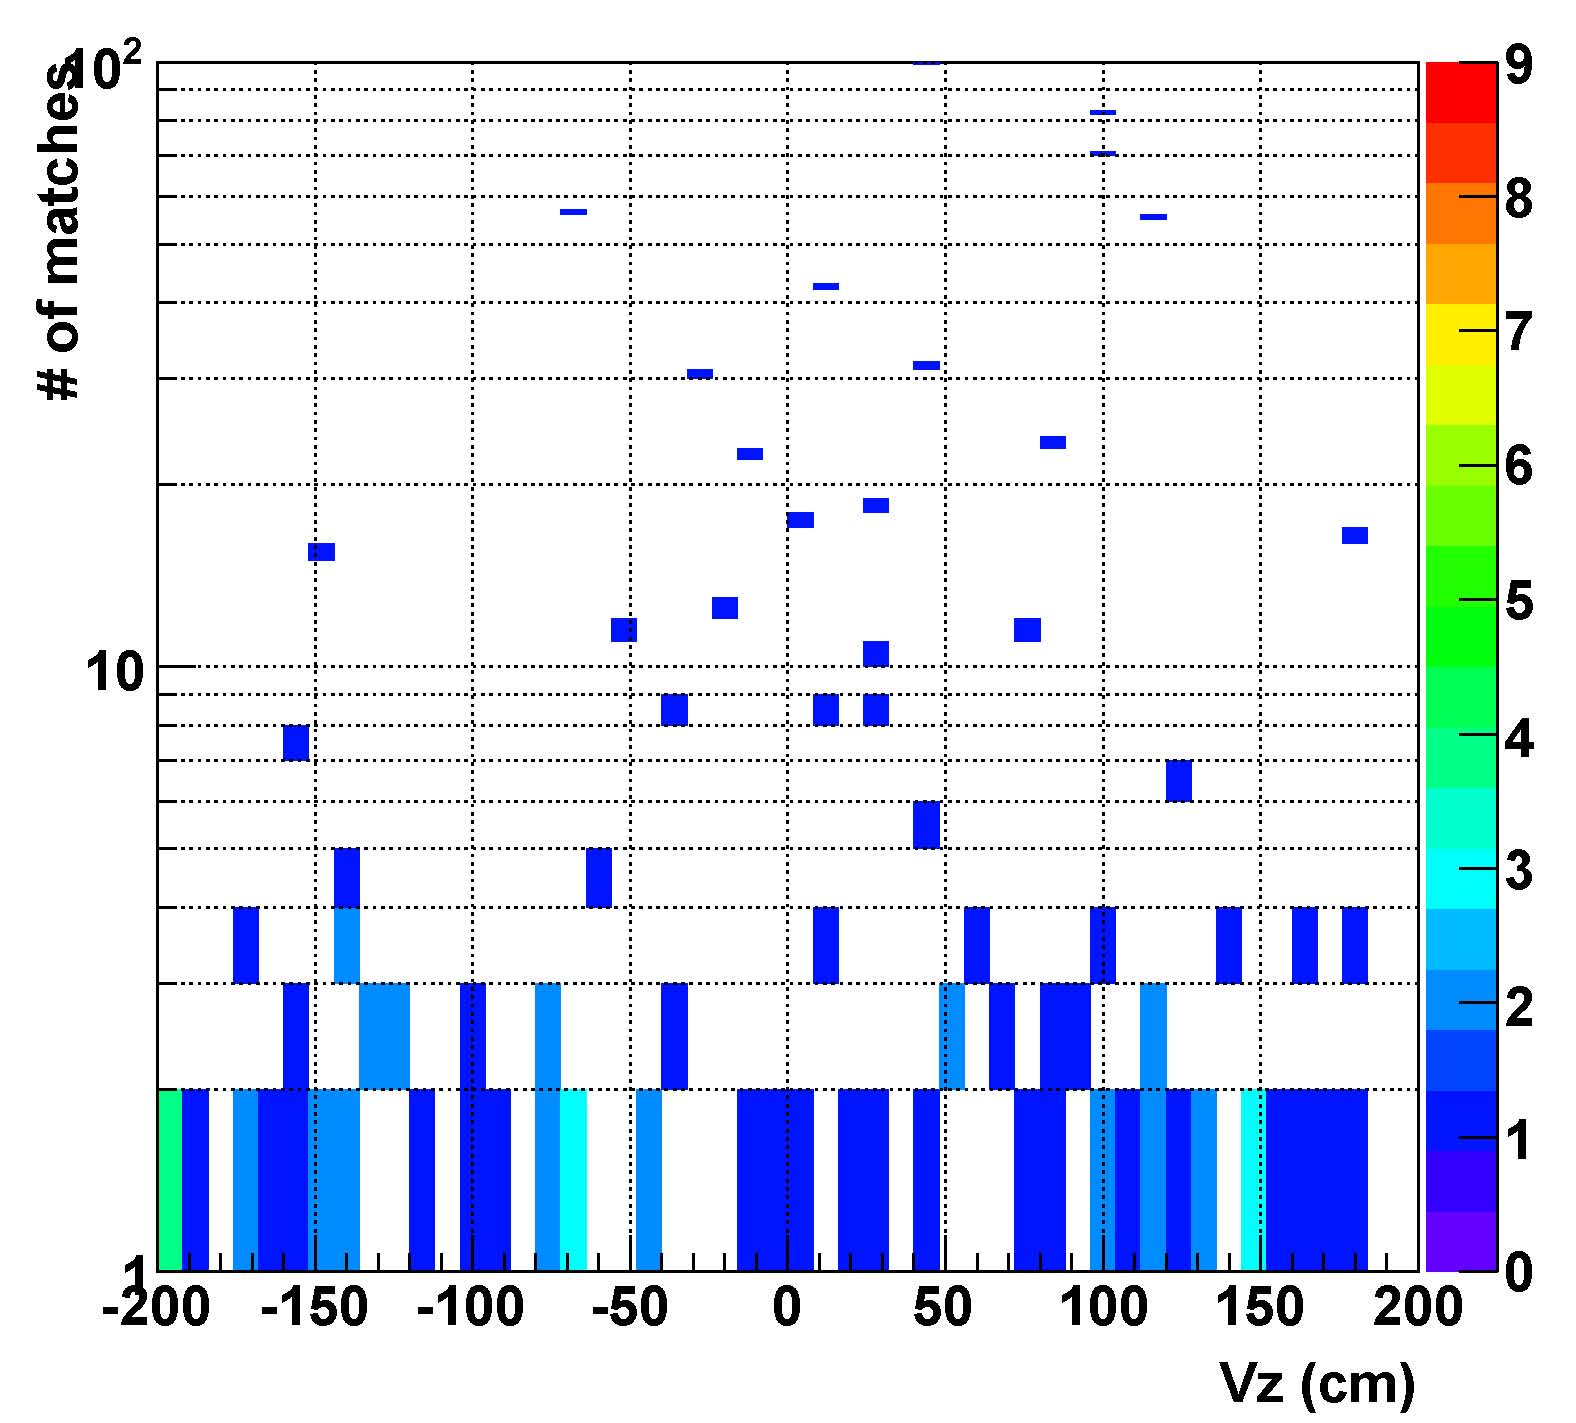 |
|
| 6,6,2 | .jpg) |
|
| 6,6,5 | 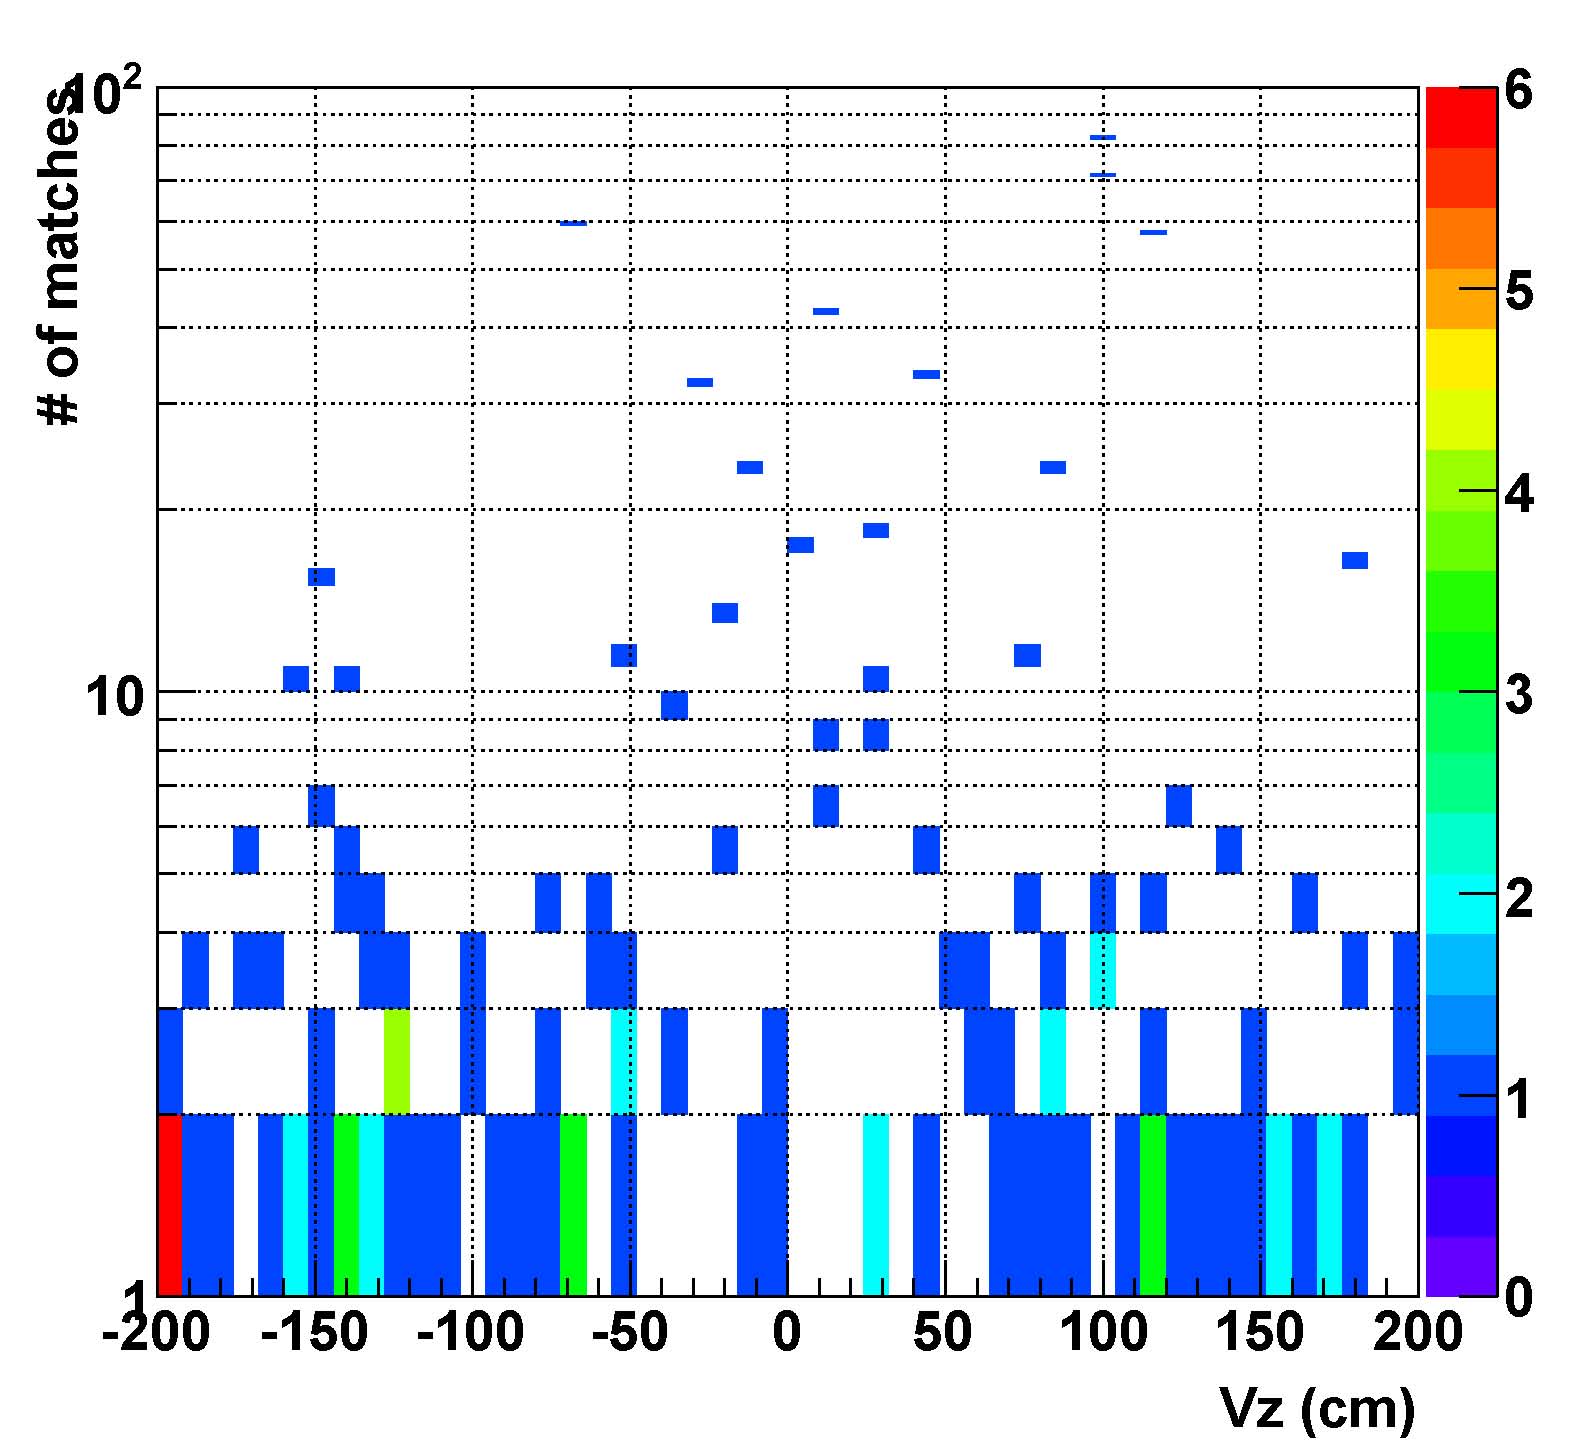 |
Table 5: nHitsBemc distributions (index 0)
| Scenerio (R, Z, N) | graph | fit |
|
1.5,3,5 (default) More Statistics |
.gif) |
|
| 1.5,6,2 | .gif) |
|
| 3,6,2 | .gif) |
|
| 3,3,2 | .gif) |
|
|
6,6,2 More Statistics |
.gif) |
|
|
6,6,5 More Statistics |
.gif) |
Table 6: nTPC crosses distributions (index 0)
| Scenerio (R, Z, N) | dca 0 | dca 0 good | dca all |
| 1.5,3,5 (default) | |||
| 1.5,6,2 | |||
| 3,6,2 | |||
| 3,3,2 | |||
| 6,6,2 | |||
| 6,6,5 |
|
Scenario (R,Z,N) |
Vx vs Vy Vertex position |
|
1.5,3,5 (default) More Statistics |
.gif) |
| 1.5,6,2 | 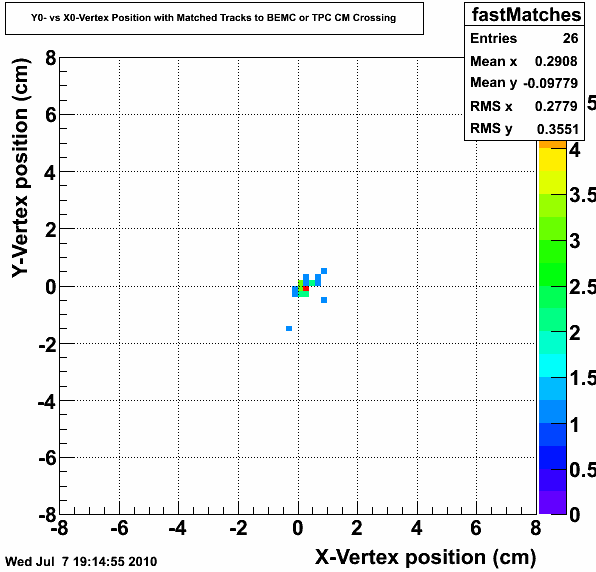 |
| 3,6,2 | 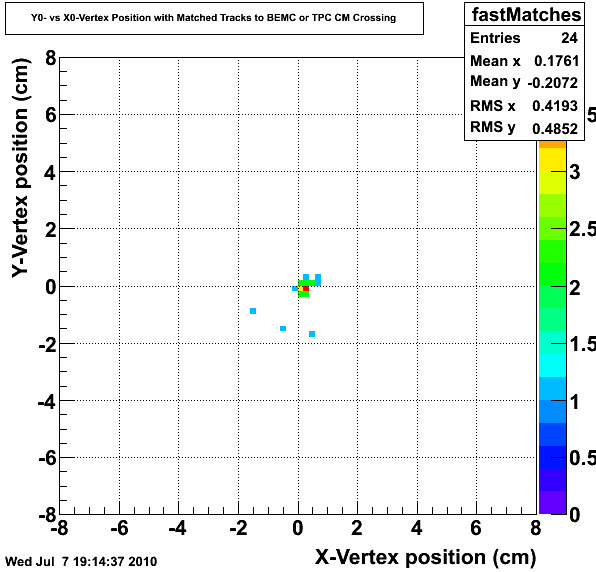 |
| 3,3,2 | 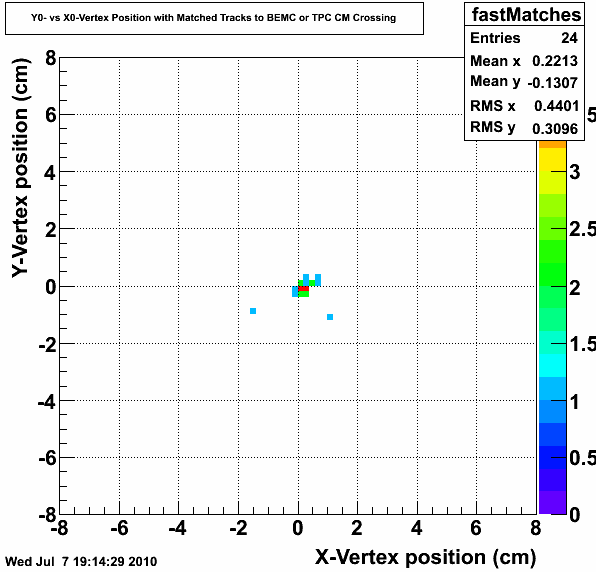 |
|
6,6,2 More Statistics |
.gif) |
|
6,6,5 More Statistics |
.gif) |
Table 7: Vx vs Vy position requiring index 0, |Vz| < 70cm, |Vr| < 2cm, and (number of BEMC matches or TPC CM Crossings) > 0
| Senario | X-Vertex Distribution | Y-Vertex Distribution | Z-Vertex Distribution | Difference Between index 0 and index 1 Z-Vertex Position |
|
1.5,3,5 (default) More Statistics |
.gif) |
 |
||
|
6,6,2 More Statistics |
.gif) |
 |
||
|
6,6,5 More Statistics |
.gif) |
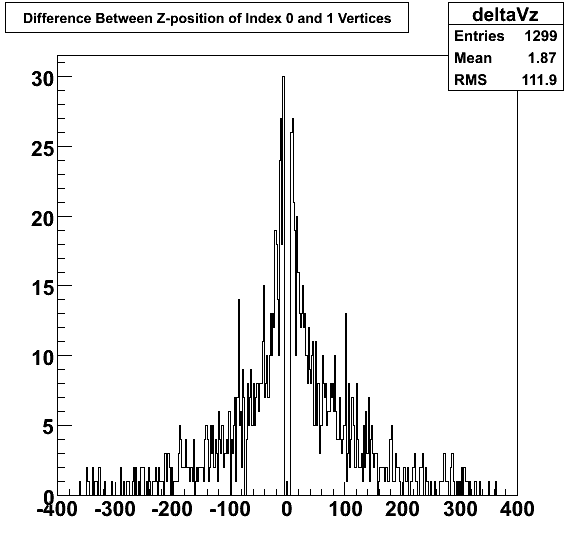 |
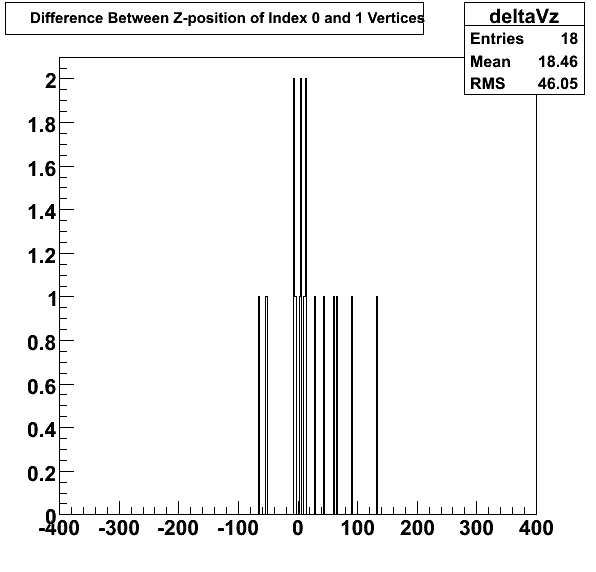
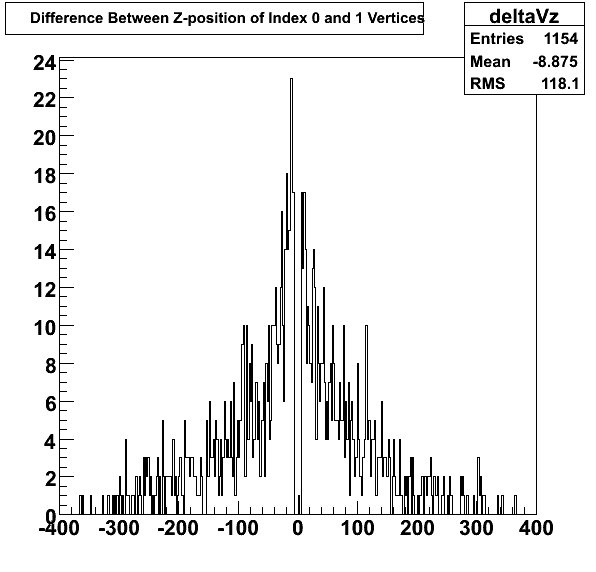
Table 8 : Histograms of the Z-vertex position Distributions in each of the scenarios with more statistics than the original plots from other tables. Black denotes index 0 and index 1 vertices distributions, red denotes index 0 only distribution, blue denotes index 1 only distribution.
- rjreed's blog
- Login or register to post comments
