ADC vs TDC in 27 GeV
Executive Summary
9 out of 744 EPD tiles were hooked up to channels with bad TDC in 2019. These 9 channels correspond to tiles:
EW1PP11TT23,24,31
EW1PP12TT14,15,22,23,30,31
These correspond to:
Crate 1 - 0x13 ch 16,23,30,31 (Label QTB EQ003)
Crate 1 - 0x17 ch 23,30,31 (Label QTB EQ006)
Crate 3 - 0x1A ch 6,7 (Label QTB EQ028)
I am a little surprised at the jumping around in the boards.... It almost looks like they cluster together in the physical detector rather than the boards which is odd.
The data came from fastoffline AuAu 27 GeV files from Days 140 - 144.
Details
For 2019 and beyond we will be incorporating EPD tiles with tile # > 9 in the trigger decision (the outer tiles). These are read out by QT32B boards, which do not have the precise timing of the QT32C boards. However, they do have a 4 bit TDC, so I had thought to include this in the trigger logic so that we could make the crude cut TDC > 0. However, in 2017 when we ran with the 54 GeV data, it looked like ~1/3 of the boards had TDCs that did not make sense, which would be far too high to use in the trigger.
Looking at this years data (fastoffline AuAu 27 GeV files from Days 140 - 144 using picoDsts), I plotted the TDC for both the QT32C and QT32B boards. All QT32C boards had good TDC. An example is:
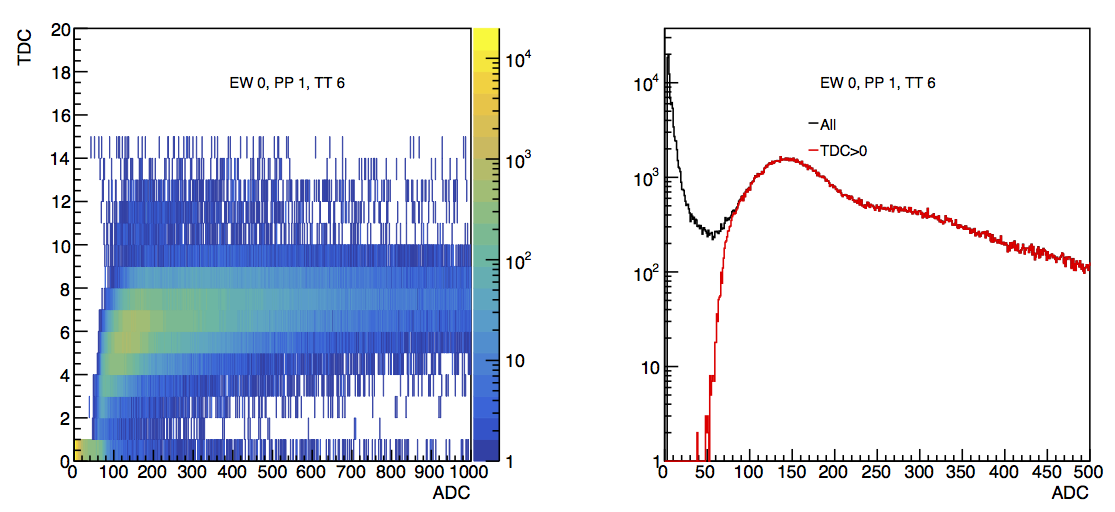
Figure 1: TDC vs ADC for EW0PP1TT6 which is a QT32C tile. On the left is ADC vs TDC. On the right is the projection of the ADC value for all TDC in black and for TDC > 0 in red.
An example QT32B board is:
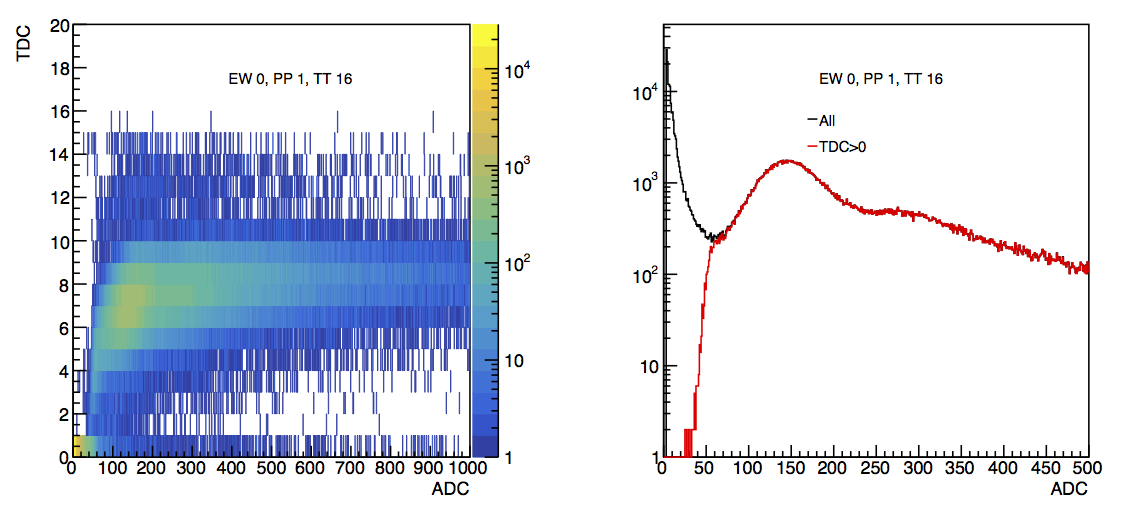
Figure 2: TDC vs ADC for EW0PP16TT6 which is a QT32B tile. On the left is ADC vs TDC. On the right is the projection of the ADC value for all TDC in black and for TDC > 0 in red.
There were 9 tiles hooked up to channels with bad TDC. An example is:
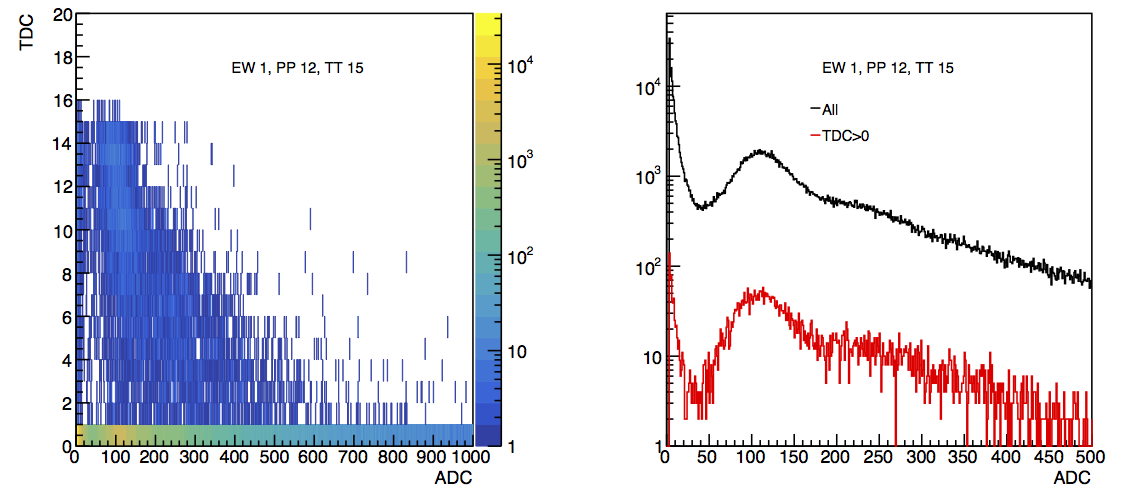
Figure 3: TDC vs ADC for EW1PP12TT5 which is a QT32B tile with a bad TDC. On the left is ADC vs TDC. On the right is the projection of the ADC value for all TDC in black and for TDC > 0 in red.
A compilation of all 744 channels can be found at: drupal.star.bnl.gov/STAR/system/files/ADCvsTDC12182018.pdf
A 24 page summary of just the ADC projections (right side of Figures 1 - 3) can be found at: drupal.star.bnl.gov/STAR/system/files/ADCwTDCcut12182018.pdf
- rjreed's blog
- Login or register to post comments