AuAu 53 GeV - A first look
Executive Summary:
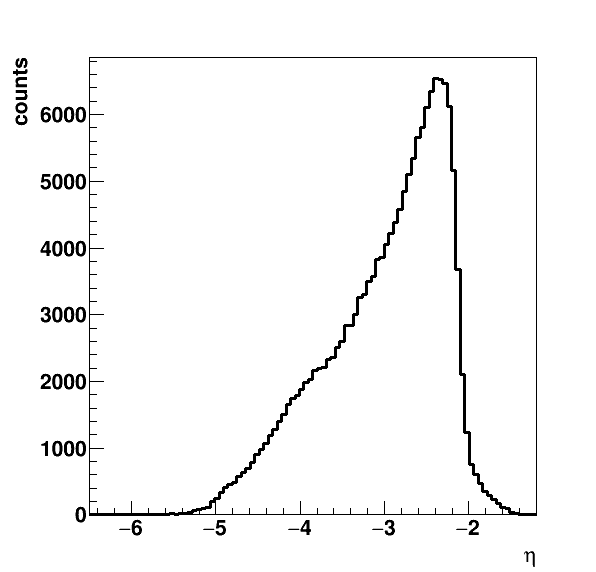
A very first look at the EPD in 53 GeV data. The dN/deta is:
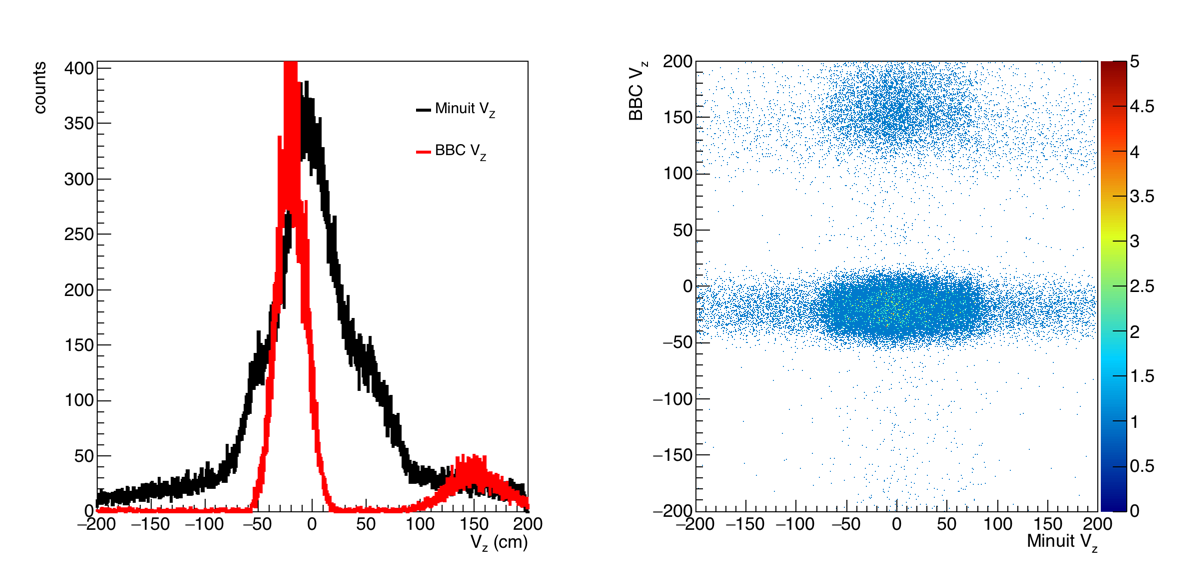
Looking at some "healthy" distributions, there is a weird double peak in the BBC Vz distribution. But I will work on this some more tomorrow:
Analysis
I am using the dNdEta.C written by Mike Lisa for this analysis. I did not comment out any lines or change it, so I think that I may have a slight issue with the mapping because I did not comment out:
AdjustMapping(EpdMaker);
Which will change the hard coding of the mapping. Ok, I will try for another pass.
The MuDsts can be found at:
/star/data09/reco/AuAu54_production_2017/ReversedFullField/dev/2017/
/star/data10/reco/AuAu54_production_2017/ReversedFullField/dev/2017/
/star/data11/reco/AuAu54_production_2017/ReversedFullField/dev/2017/
/star/data12/reco/AuAu54_production_2017/ReversedFullField/dev/2017/
And for the moment, I am running over the st_physics stream with no additional selection criteria. The threshold for "hit/no-hit" is 10, this is something we will want to shortly change.
The plots below are from 5000 events that I ran over using the scheduler. I tried to run over all available files, that might come through in the morning, but I think I needed to break things up into more reasonable chunks.
The mapping is best represented by this picture from Mike:

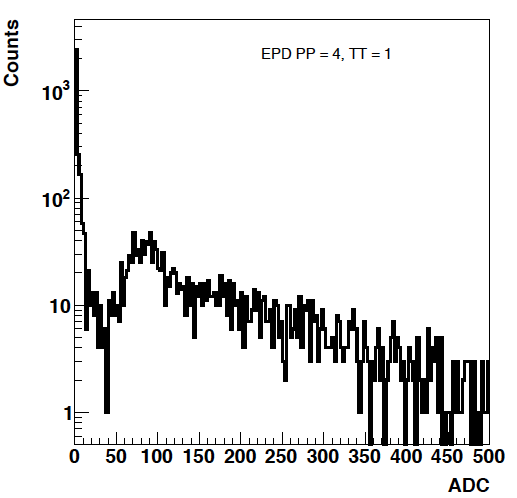
It has been noted that the TDC does not work in all channels. (The modified QT8 daughter boards, and some channels of the 32B have not been working.)
My next iteration of the following plots will also have the board type, address and ch printed on it. But I didn't feel like it this time... :-)
First the ADC:
drupal.star.bnl.gov/STAR/system/files/ADC_EPD_EPDhists_B46F0648892E792B65CEF1A90E802319_0.root_.pdf
And the TAC (note I just ran the loop without selection)
drupal.star.bnl.gov/STAR/system/files/TAC_EPD_EPDhists_B46F0648892E792B65CEF1A90E802319_0.root_.pdf
And the TDC:
drupal.star.bnl.gov/STAR/system/files/TDC_EPD_EPDhists_B46F0648892E792B65CEF1A90E802319_0.root_.pdf
With stereotypical plots of:
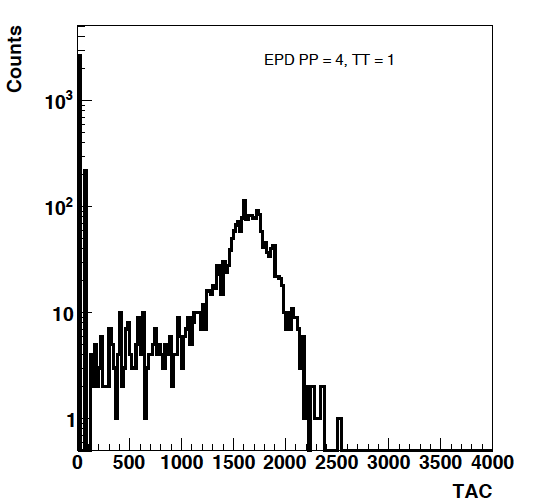
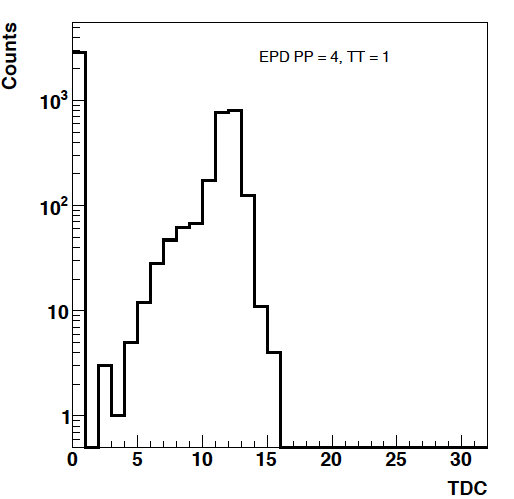
AFAIK no more split peaks!
Then the 2D distributions:
ADC vs TAC
drupal.star.bnl.gov/STAR/system/files/TACvsADC_EPD_EPDhists_B46F0648892E792B65CEF1A90E802319_0.root_.pdf
TDC vs TAC
And some examples:
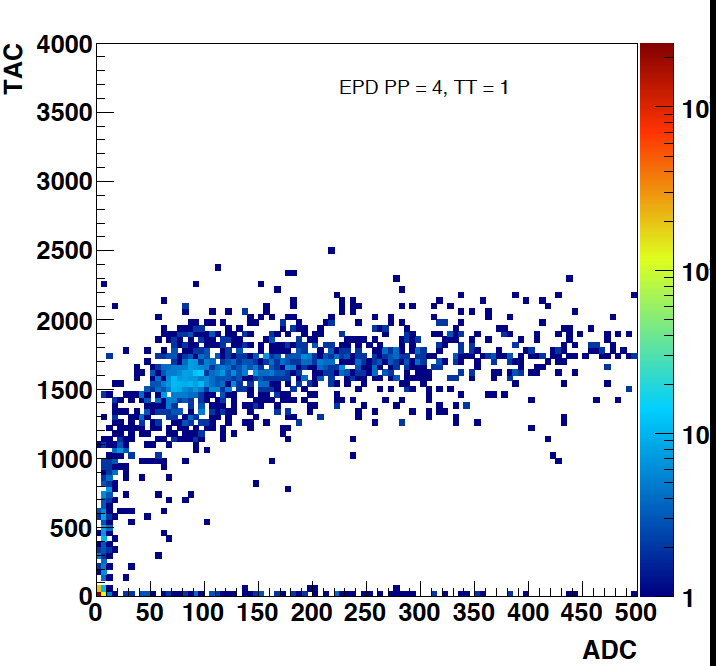


Looks reasonable...
Then for the pretty pictures:

And dN/deta:
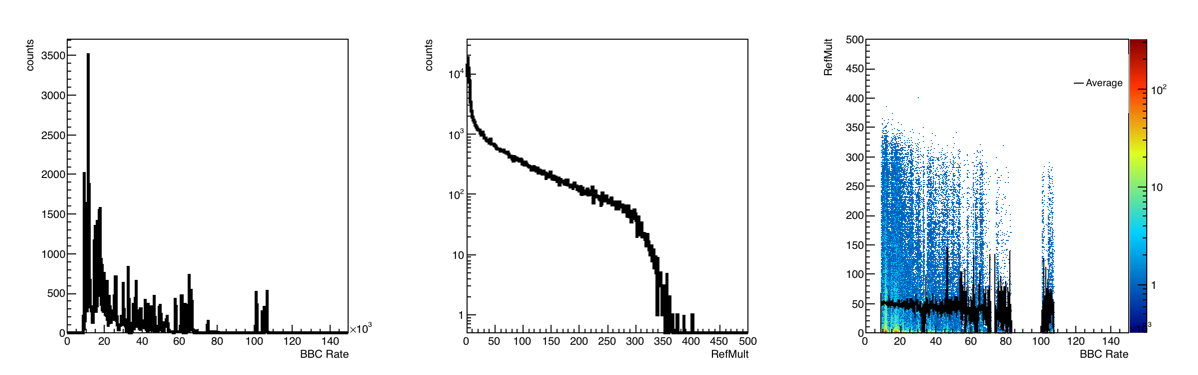
And some first QA plots:

- rjreed's blog
- Login or register to post comments