AuAu 54 GeV - Triggers and Eval Part 1
Executive Summary: drupal.star.bnl.gov/STAR/system/files/RReedEPD06192017.pdf
NOTE: Mapping in drawing macro was not correct, the PP and TT for this analysis is correct but the QT is incorrect. This will be redone, with this mapping:
drupal.star.bnl.gov/STAR/subsys/epd/mapping/mapping-53-gev-auau-run-30-may-2017
The minimum bias triggers are:
580001 - From 18153049 - 18156032
580011 - From 18156033 - 18156035
580021 - From 18156046 - 18168050
The luminosity right now looks like:


So, over 1B events!!
The run numbers currently spanning the 54 GeV run are 18153035 - 18168051
In the following data, I did not select all the data available because I did something stupid with the scheduler. Whoops! But it's enough to start to see things. I also am currently using all triggers, but I have |Vz|< 50 cm and Vr < 2 cm.
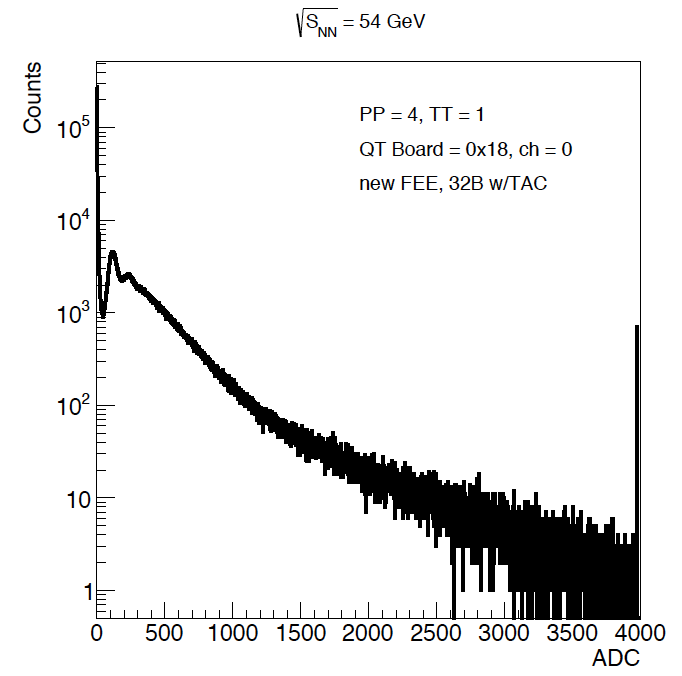
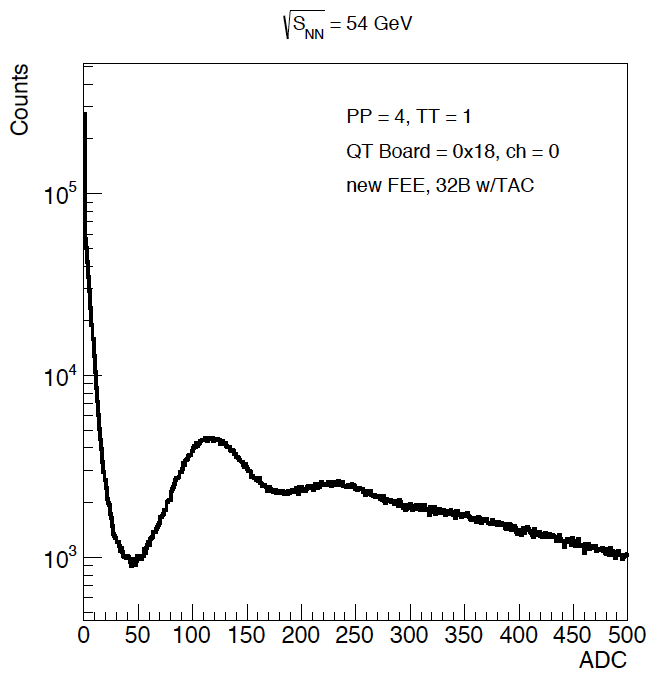
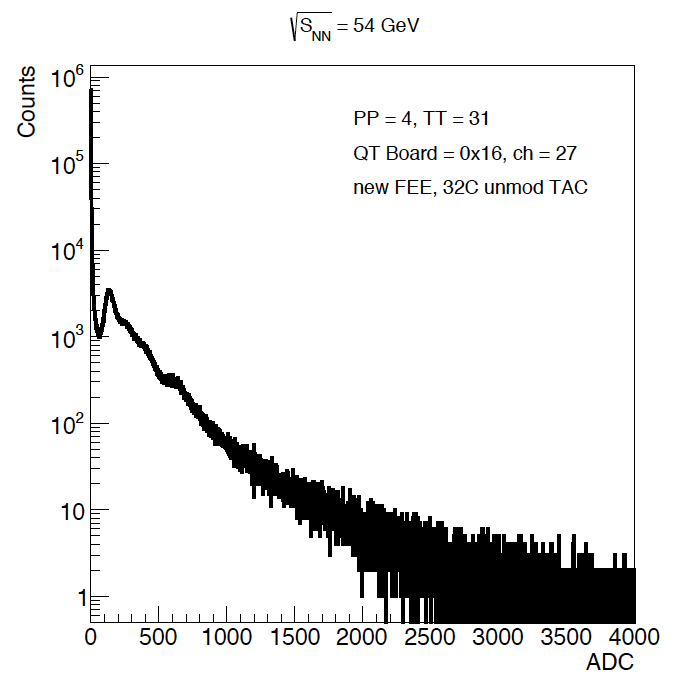
ADC:
Full 93 channels:
drupal.star.bnl.gov/STAR/system/files/EPDADC_exampleTree_C7FCD53A57AB059DCD1E4236FF07DBBD.root_.pdf
Some distributions look strange, mainly:

Also, PP = 4, TT = 30, PP = 5, TT = 8, PP = 5, TT = 10, PP = 5, TT = 12, PP = 5, TT = 14, PP = 6, TT = 26-31 have a single spike (probably one bad run).
PP = 6, TT = 19, PP = 6, TT = 21, PP = 6, TT = 23, PP = 6, TT = 25 have 2 -3 spikes (also probably can be removed by data QA).
TDC
The statistics for those channels with TDC can be seen:
drupal.star.bnl.gov/STAR/system/files/EPDTDC_exampleTree_C7FCD53A57AB059DCD1E4236FF07DBBD.root_.pdf
A good and weird example can be seen at:
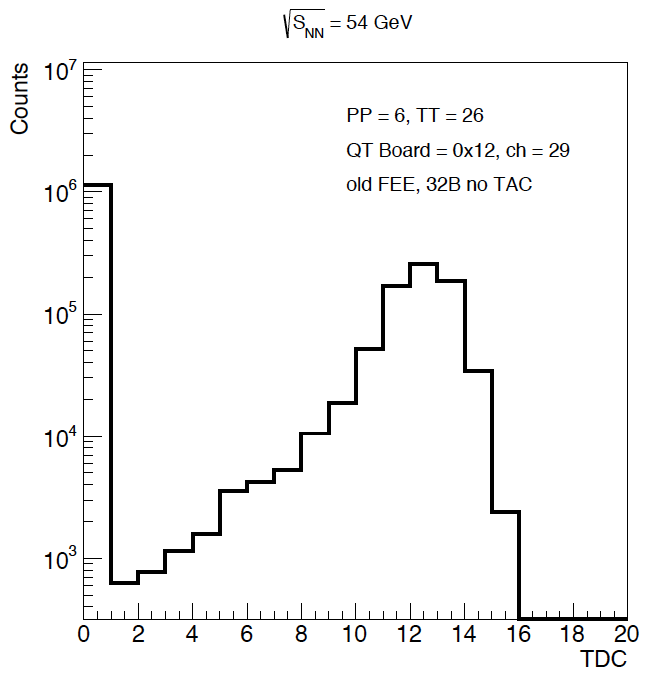

There are a number of weird distributions ... It would be interesting to know whether the variation makes the TDC harder to deal with than it would be to ignore it!
TDC vs ADC
The distributions look rather like the TAC vs ADC one. We can see the results from all channels at:
drupal.star.bnl.gov/STAR/system/files/EPDADCvsTDC_exampleTree_C7FCD53A57AB059DCD1E4236FF07DBBD.root_.pdf
And the same "good" and "weird" 2D distributions at:
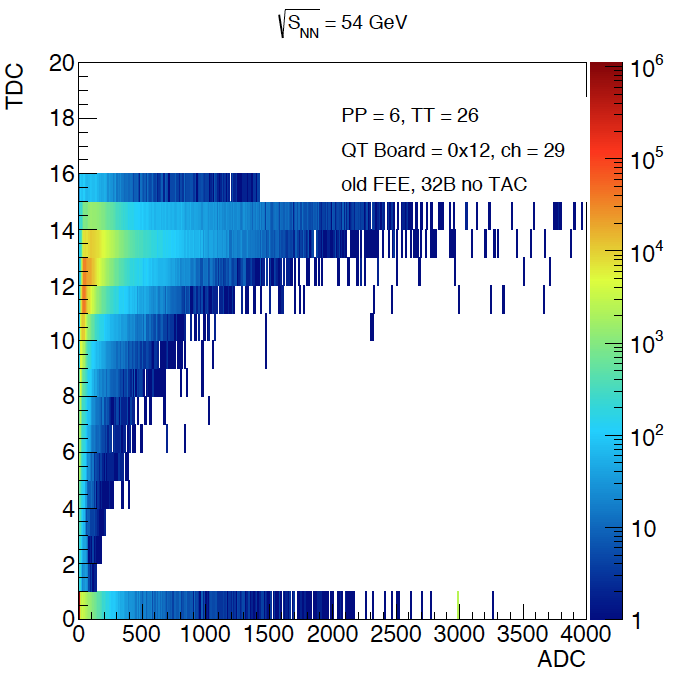

But the real question is what this does to our ADC distributions. Selecting on TDC > 0 channel by channel, compared to no selection can be seen at:
drupal.star.bnl.gov/STAR/system/files/TDCSel_EPDhists_C7FCD53A57AB059DCD1E4236FF07DBBD.root_.pdf
Using the 2 channels above as our examples, we see:


This shows that all the weird channels shouldn't be used, they have a weird effect on the distribution. This means that the channels that can be used are (also in attached text file):
PP TT Address ch type FEE Clips MIP
4 2 0x10 1 32B no TAC old
4 4 0x10 2 32B no TAC old
4 6 0x10 3 32B no TAC old
4 8 0x10 4 32B no TAC old
4 9 0x16 8 32C mod TAC new
4 10 0x10 5 32B no TAC old
4 11 0x16 11 32C mod TAC new
4 13 0x16 16 32C mod TAC new
4 15 0x16 19 32C mod TAC new
4 16 0x10 8 32B no TAC old
4 17 0x16 0 32C unmod TAC new yes
4 18 0x10 9 32B no TAC old
4 19 0x16 1 32C unmod TAC new
4 20 0x10 10 32B no TAC old
4 21 0x16 2 32C unmod TAC new yes
4 22 0x10 11 32B no TAC old
4 23 0x16 3 32C unmod TAC new yes
4 24 0x10 12 32B no TAC old
4 25 0x16 24 32C unmod TAC new yes
4 26 0x10 13 32B no TAC old
4 27 0x16 25 32C unmod TAC new yes
4 29 0x16 26 32C unmod TAC new
4 31 0x16 27 32C unmod TAC new yes
5 1 0x12 0 32B no TAC old
5 2 0x18 9 32B w/TAC old
5 3 0x12 1 32B no TAC old
5 4 0x18 10 32B 2/TAC old
5 5 0x12 2 32B no TAC old
5 6 0x18 11 32B w/TAC old
5 7 0x12 3 32B no TAC old
5 8 0x18 16 32B w/TAC old
5 9 0x12 4 32B no TAC old
5 10 0x18 17 32B w/TAC old
5 11 0x12 5 32B no TAC old
5 12 0x18 18 32B w/TAC old
5 14 0x18 19 32B w/TAC old
5 16 0x18 24 32B w/TAC old
5 17 0x12 8 32B no TAC old
5 18 0x18 25 32B w/TAC old
5 19 0x12 9 32B no TAC old
5 20 0x18 26 32B w/TAC old
5 21 0x12 10 32B no TAC old
5 22 0x18 27 32B w/TAC old
5 23 0x12 11 32B no TAC old
5 25 0x12 12 32B no TAC old
5 27 0x12 13 32B no TAC old
6 1 0x10 16 32B no TAC old
6 2 0x12 17 32B no TAC old
6 3 0x10 17 32B no TAC old
6 5 0x10 18 32B no TAC old
6 6 0x12 19 32B no TAC old
6 7 0x10 19 32B no TAC old
6 8 0x12 20 32B no TAC old
6 9 0x10 20 32B no TAC old
6 10 0x12 21 32B no TAC old
6 11 0x10 21 32B no TAC old
6 16 0x12 24 32B no TAC old
6 17 0x10 24 32B no TAC old
6 18 0x12 25 32B no TAC old
6 19 0x10 25 32B no TAC old
6 20 0x12 26 32B no TAC old
6 21 0x10 26 32B no TAC old
6 22 0x12 27 32B no TAC old
6 23 0x10 27 32B no TAC old
6 24 0x12 28 32B no TAC old
6 25 0x10 28 32B no TAC old
6 26 0x12 29 32B no TAC old
6 27 0x10 29 32B no TAC old
TAC
The TAC distributions can be seen at:
drupal.star.bnl.gov/STAR/system/files/EPDTAC_exampleTree_C7FCD53A57AB059DCD1E4236FF07DBBD.root_.pdf
An example is:

The spikes are probably due to some runs where the pedestal wasn't properly taken care of. As can be seen in the pdf, in some of the channels without TAC we saw some weird spikes. Once I can QA by run number, we can take care of this.
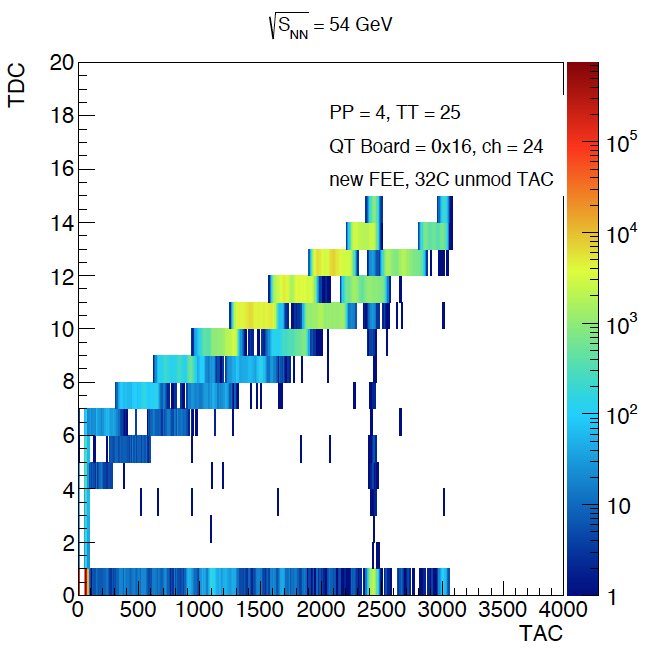
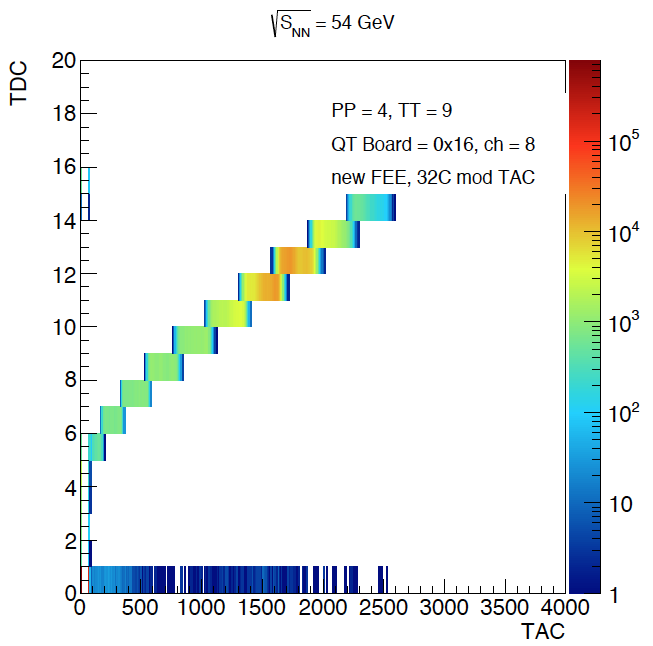
TAC vs TDC
Since both the TAC and TDC should be related to the same quantity, we'd expect a nice correlation in those channels that have both an operating TDC and TAC. The values for those channels that fit this description are at:
drupal.star.bnl.gov/STAR/system/files/EPDTACvsTDC_exampleTree_C7FCD53A57AB059DCD1E4236FF07DBBD.root_.pdf
Oddly enough, there are some that have a double peak-like structure. You can see a "good" and "bad" distribution at:
TAC vs ADC
The compilation of all the distributions is at:
drupal.star.bnl.gov/STAR/system/files/EPDADCvsTAC_exampleTree_C7FCD53A57AB059DCD1E4236FF07DBBD.root__0.pdf
In some of these we can see the same double structure in the TDC. I guess this is similar to the 5 fingers we were seeing with the prototype last year, 54 GeV will have a fatter beam so perhaps we can see less of it. We can see the advantage of the gain at least, looking at these two example plots.
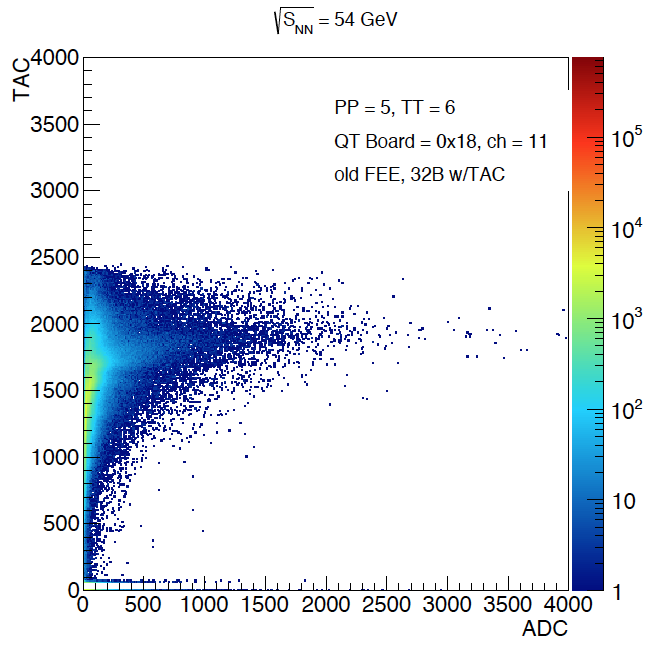

I think the spike has been seen in other plots, and can probably be removed with reasonable QA.
Other QA

These distributions mainly show that my cut was employed. But even when I had the full Vx-Vy distribution, I didn't really see much in the way of beam pipe events. Perhaps it is simply the higher energy (I mainly studied them in 7.7 GeV in BESI), or maybe they aren't using the BESII Vertex parameters to reconstruct the events. If that is the case, then this is something we'd have to keep an eye on!
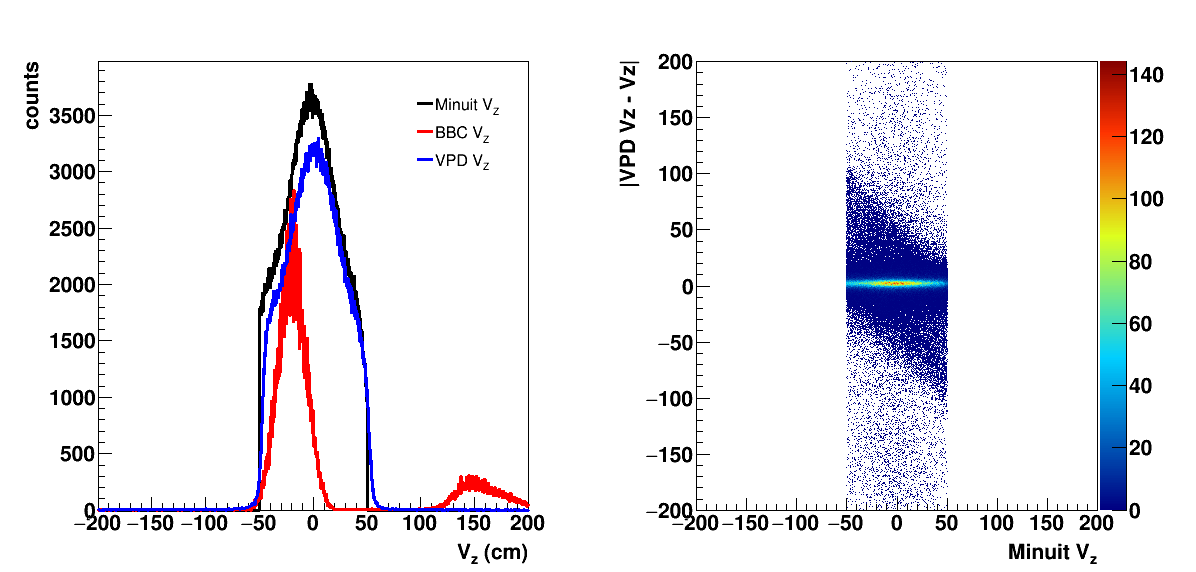
On the left are the Vz distributions for all different vertex definitions. One coming from the VPD (blue) and the BBC (red) and from the vertexer. I don't know why the BBC distribution has a secondary hump. The black is what comes from reconstructing the vertex with TPC tracks. On the right is the correlation between the Minuit Vz, and the difference in VPD Vz and the Minuit Vz. If they were perfect, this distribution would be a flat line at 0.
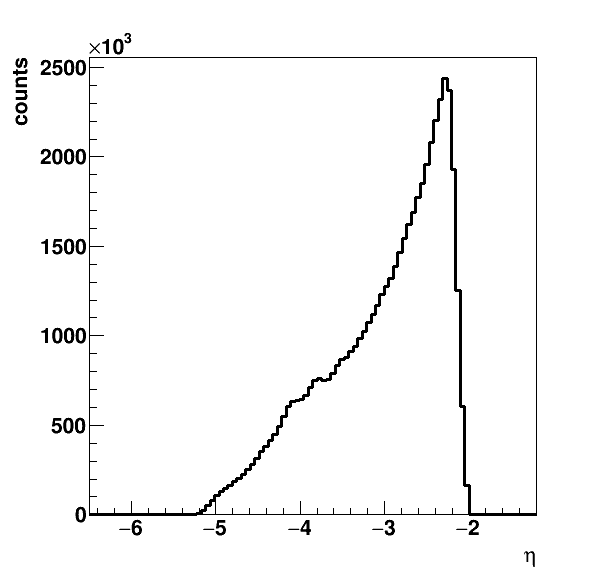
Uncorrected dN/deta for all selected events.

The xy and eta-phi distributions. The phi-eta distribution are not sharp due t the fact that the vertex doesn't have to be at Vx=Vy=Vz.
Using a slightly earlier launch, I also made the rainbow plot which can be seen at:

Here we can see that we don't have a precisely uniform response, it's hard to see with the colors, but a few channels in PP4 on the top seem to be firing more than they ought to. I would have to look at my thresholds again, it's possible that things have shifted as we ran. I'm not too concerned at the moment. But this is something that should be looked at!
We also looked at the multiplicity in the TOF vs the EPD, which looks like:

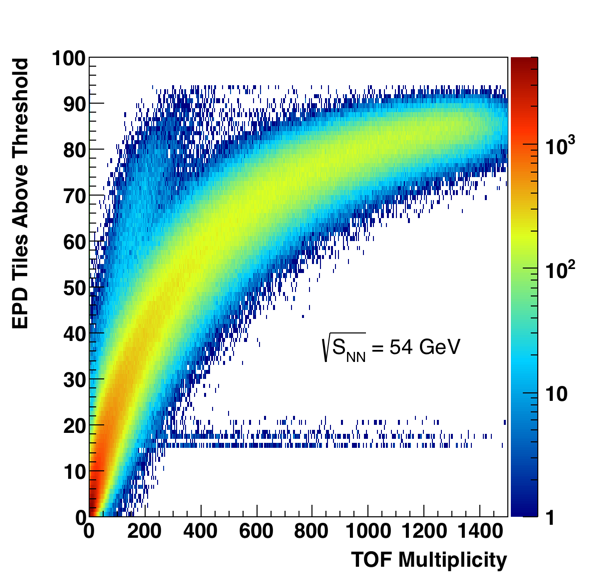
The curve is not the result of only having 93 tiles, but rather the physics inherent in the situation. There is a weird finger of data with low TOF mult and high EPD mult. The only difference between the plots is for the left I required 20 counts or above for the minimum color. I know that the TOF had some runs with strange issues, which could be the two horizontal lines, but I'm more puzzled at this finger.
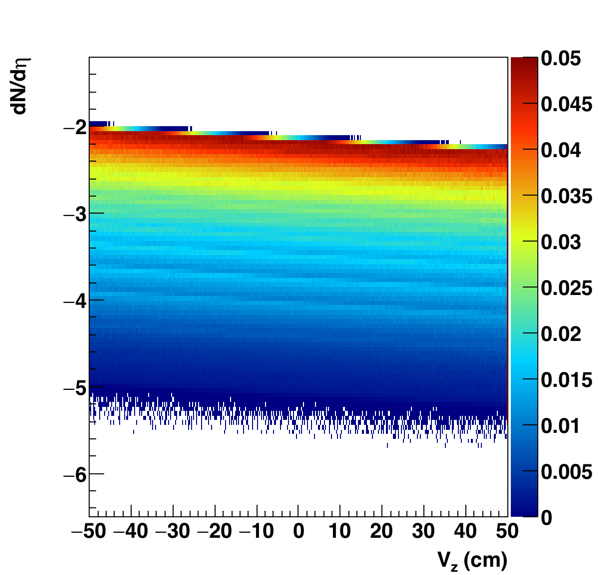
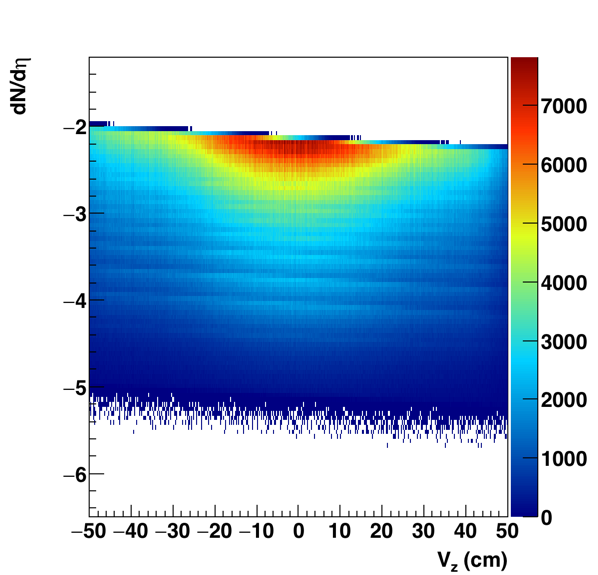
The distribution of dN/deta versus Vz, as comes from the data directly on the right and after normalization on the left. We can see there is a definite difference as the collision takes place away from the EPD. If we break up the distribution into 4 cm bins, we get:

- rjreed's blog
- Login or register to post comments