Centrality and the EPD
Using the trigger object, we can look at the relationship between the multiplicity in the tof and the adc sum in the EPD for a single run (no selection on trigger). This gives use the following distributions:
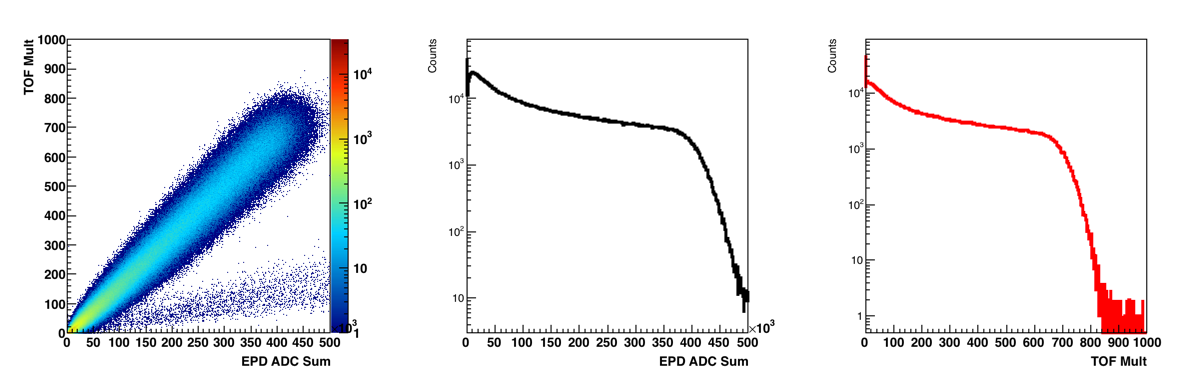
Figure 1: On the left is the Tof Mult vs EPD Multiplicity. In the middle is the EPD ADC sum (X projection of the left). On the right is the TOF Mult (Y Projection of the left).
I do not know why there is this second class of events seen in the left plot of figure 1. But one thing we should note is that the distribution is extremely linear, indicating that selection centrality with the EPD will give us a very reasonable mid-rapidity centrality selection.
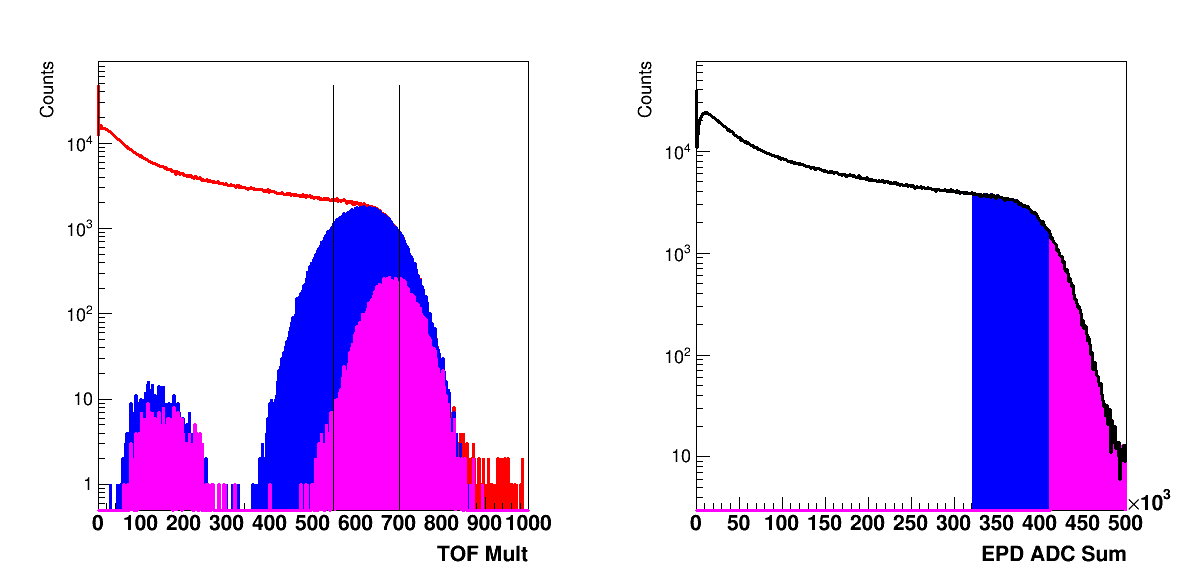
Figure 2: Centrality selections on the EPD and resulting TOF distributions. In blue is the 0 - 10%, in purple is the 0 - 1%. The lines on the left plot show where the 0 - 10% or 0 - 1% cuts would be for the TOF Mult.
Then the question was raised whether we should lower our SiPM bias voltage in order to decrease the probability that we would have saturated ADCs in central events. First I looked to see how many tiles saturated versus TOF Mult.
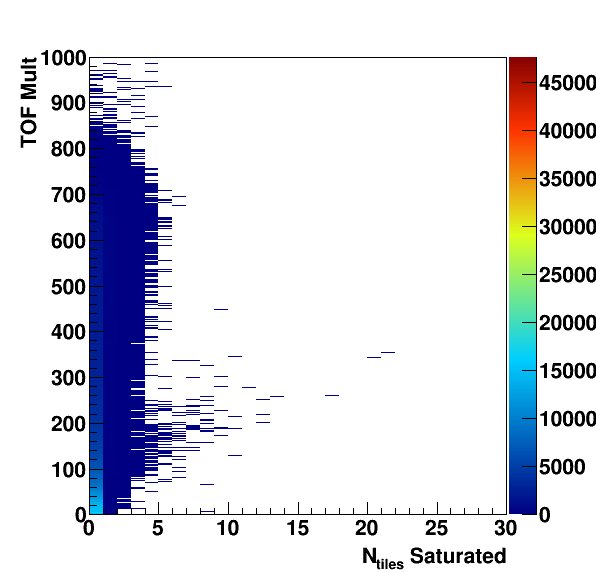
Figure 3: Number of saturated tiles versus the TOF multiplicity.
From Figure 3 it can be seen that there is some centrality dependence, that more central events are more likely to have multiple tiles that are saturated, but the number is still small. We can also see some weird peak in the lower TOF Mult distribution, I suspect this is the same structure that I didn't understand above. However, we can see that the saturation effects are extremely minimal.
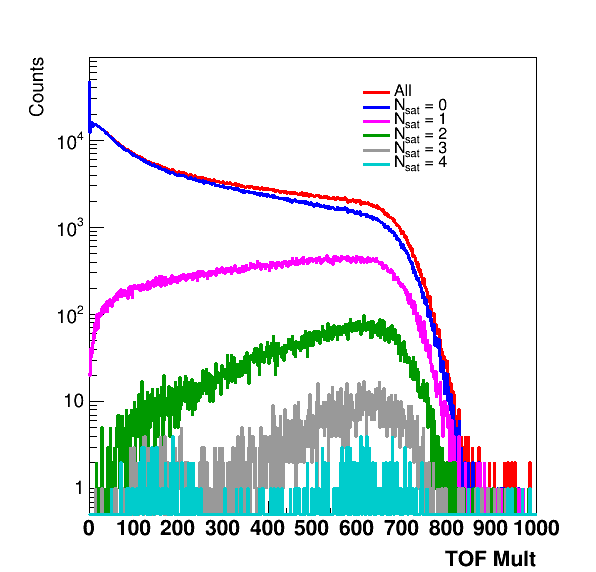
Figure 4: Tof Mult distributions for selections on different numbers of EPD tiles that have a saturated ADC.
- rjreed's blog
- Login or register to post comments