EPD "Cold" Tile Issue.
Executive summary
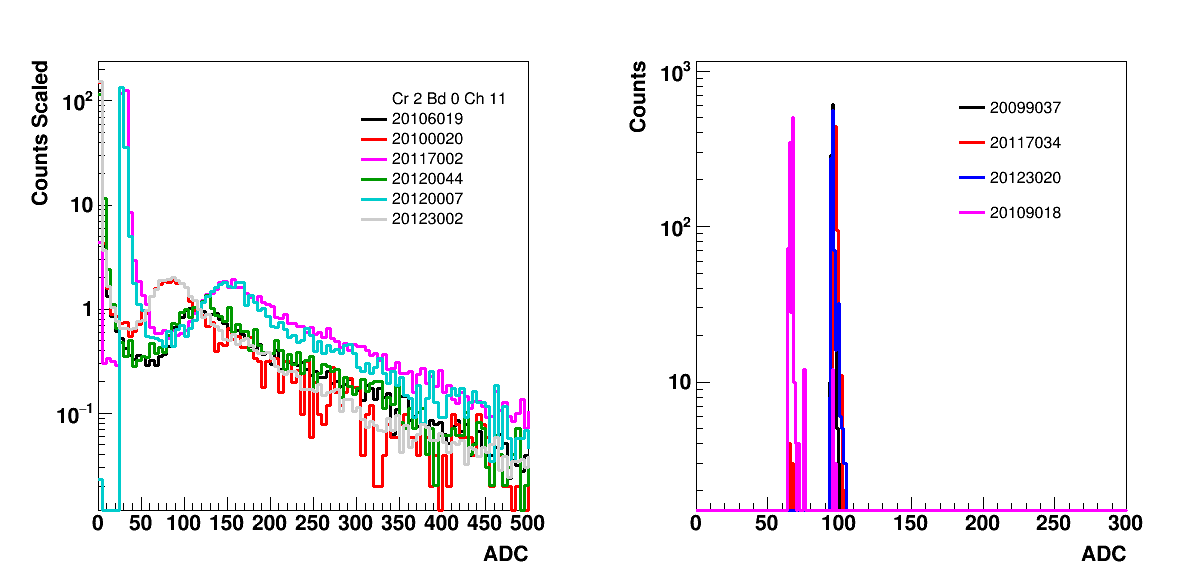
The EPD cold tiles issue was the result of changing the algorithm running from v6.4 to v7.0a in the QT32B located in EQ2 0x11 (board #0). This resulted in the multiple peak structure seen on the right side of figure 0 in purple for pedestal distributions. The effect on the ADC spectra can be seen on the right of this figure. Note that the change spanned day 105 - 122. The distribution in ADC was effectively shifted, so the noise was at ADC ~50 and not 0. As we define a hit as ADC > 16, this caused these tiles to continue to fire with a relatively low ADC, causing the <ADC> to be lower than before which made the tiles appear cold. The ADC of the MIP peak itself was increased by about 50% due to changes in the algorithm. Once returning to v6.4, we no longer had the cold tile issue.
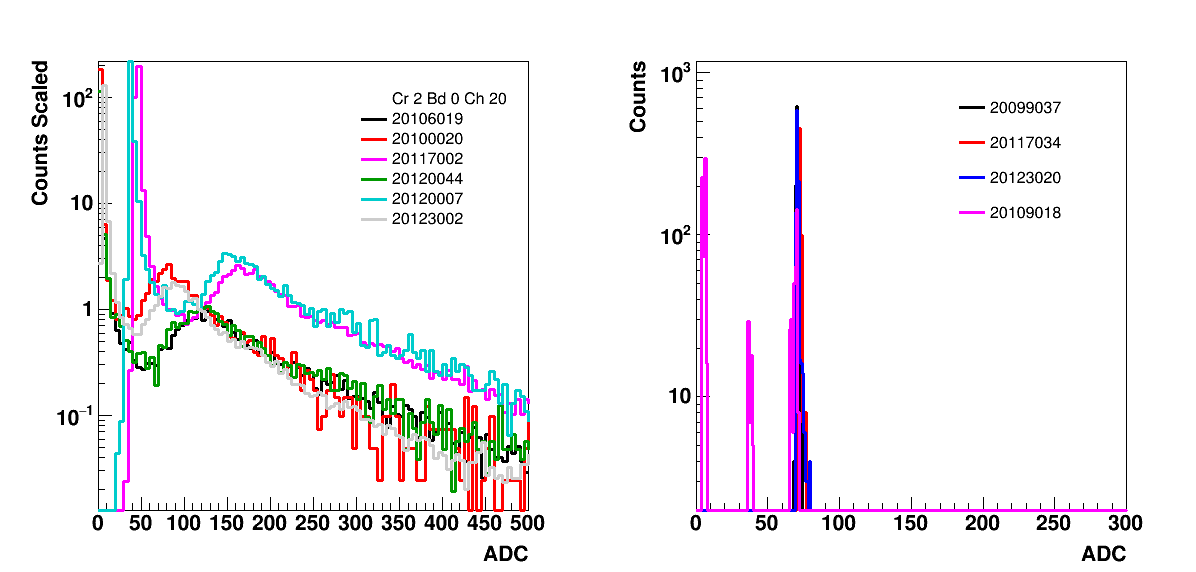
Figure 0: ADC spectra on the left and pedestals on the right for 1 of the 3 affected tiles.
Given the difficulties in adding the QT32B to the trigger logic, it would probably be best to table this project.
Details
It was noticed that the EPD had what appeared to be cold tiles. Looking at an example from the over, at both the number of hits (uncalibrated) and the average ADC, we see the following figures.
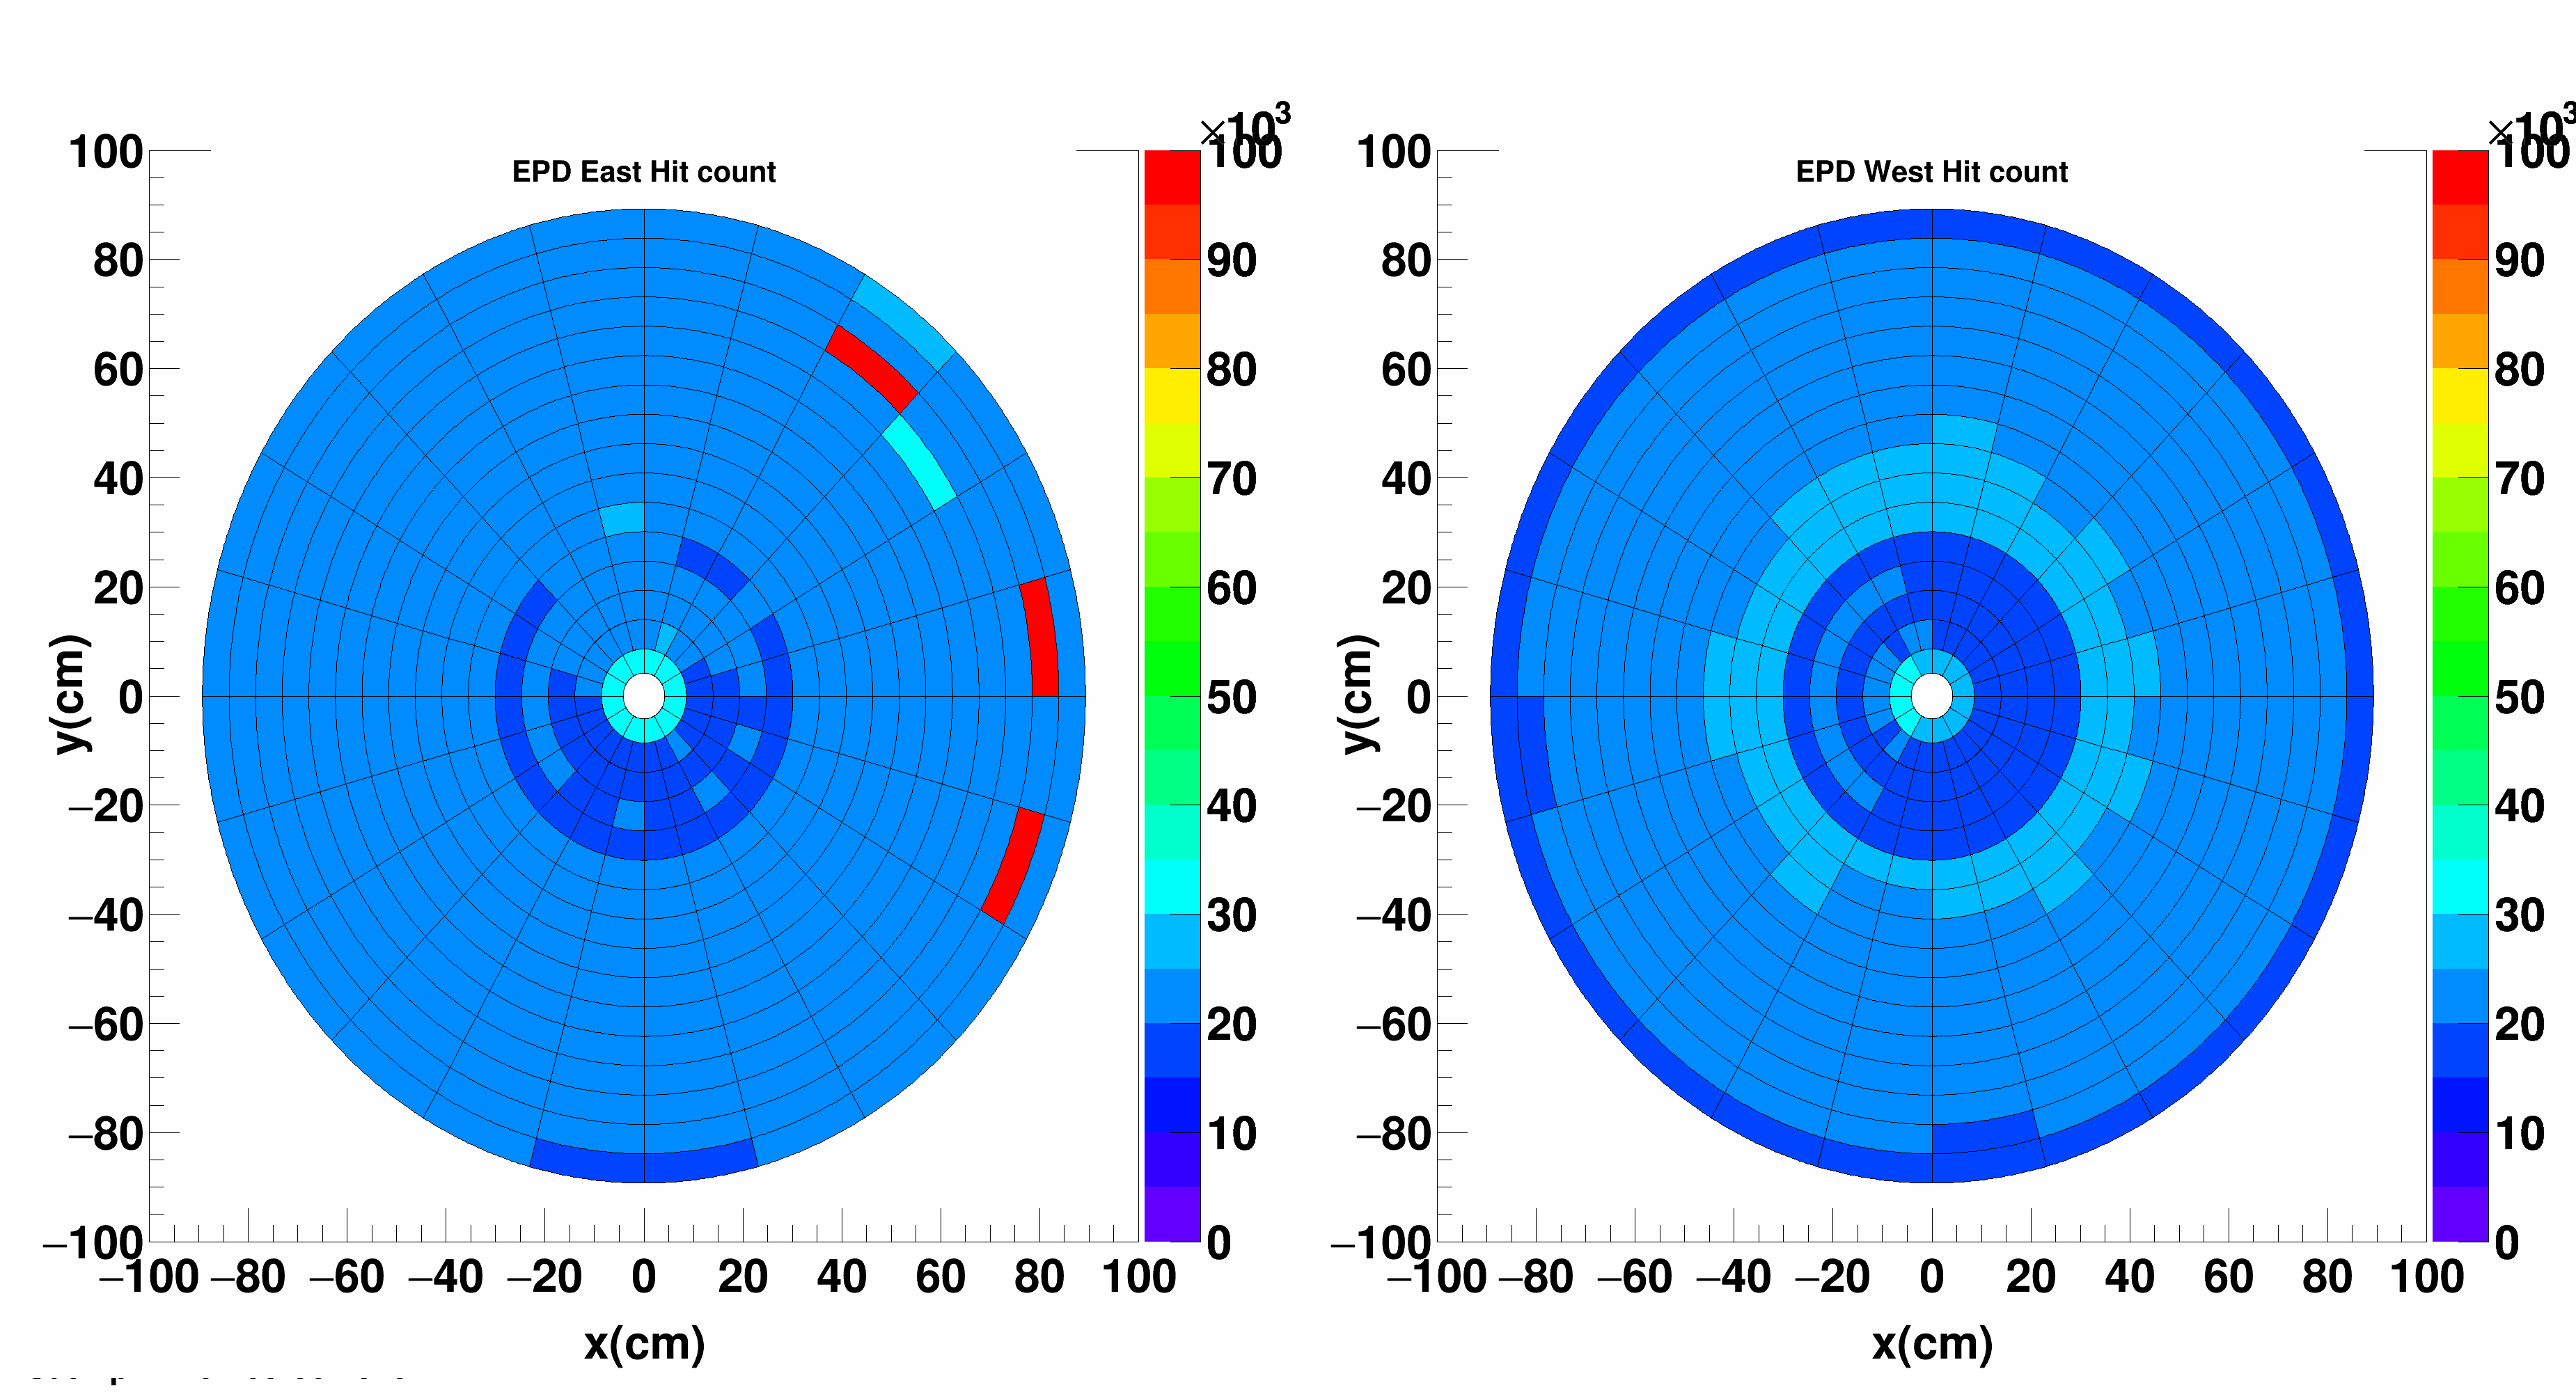
Figure 1: Hit map for run 20117002 which shows the issue in 3 of the tiles.

Figure 2: ADC map for run 20117002 which shows the issues in 3 of the tiles.
We can compare this to another file where this isn't the case, which I will show below:
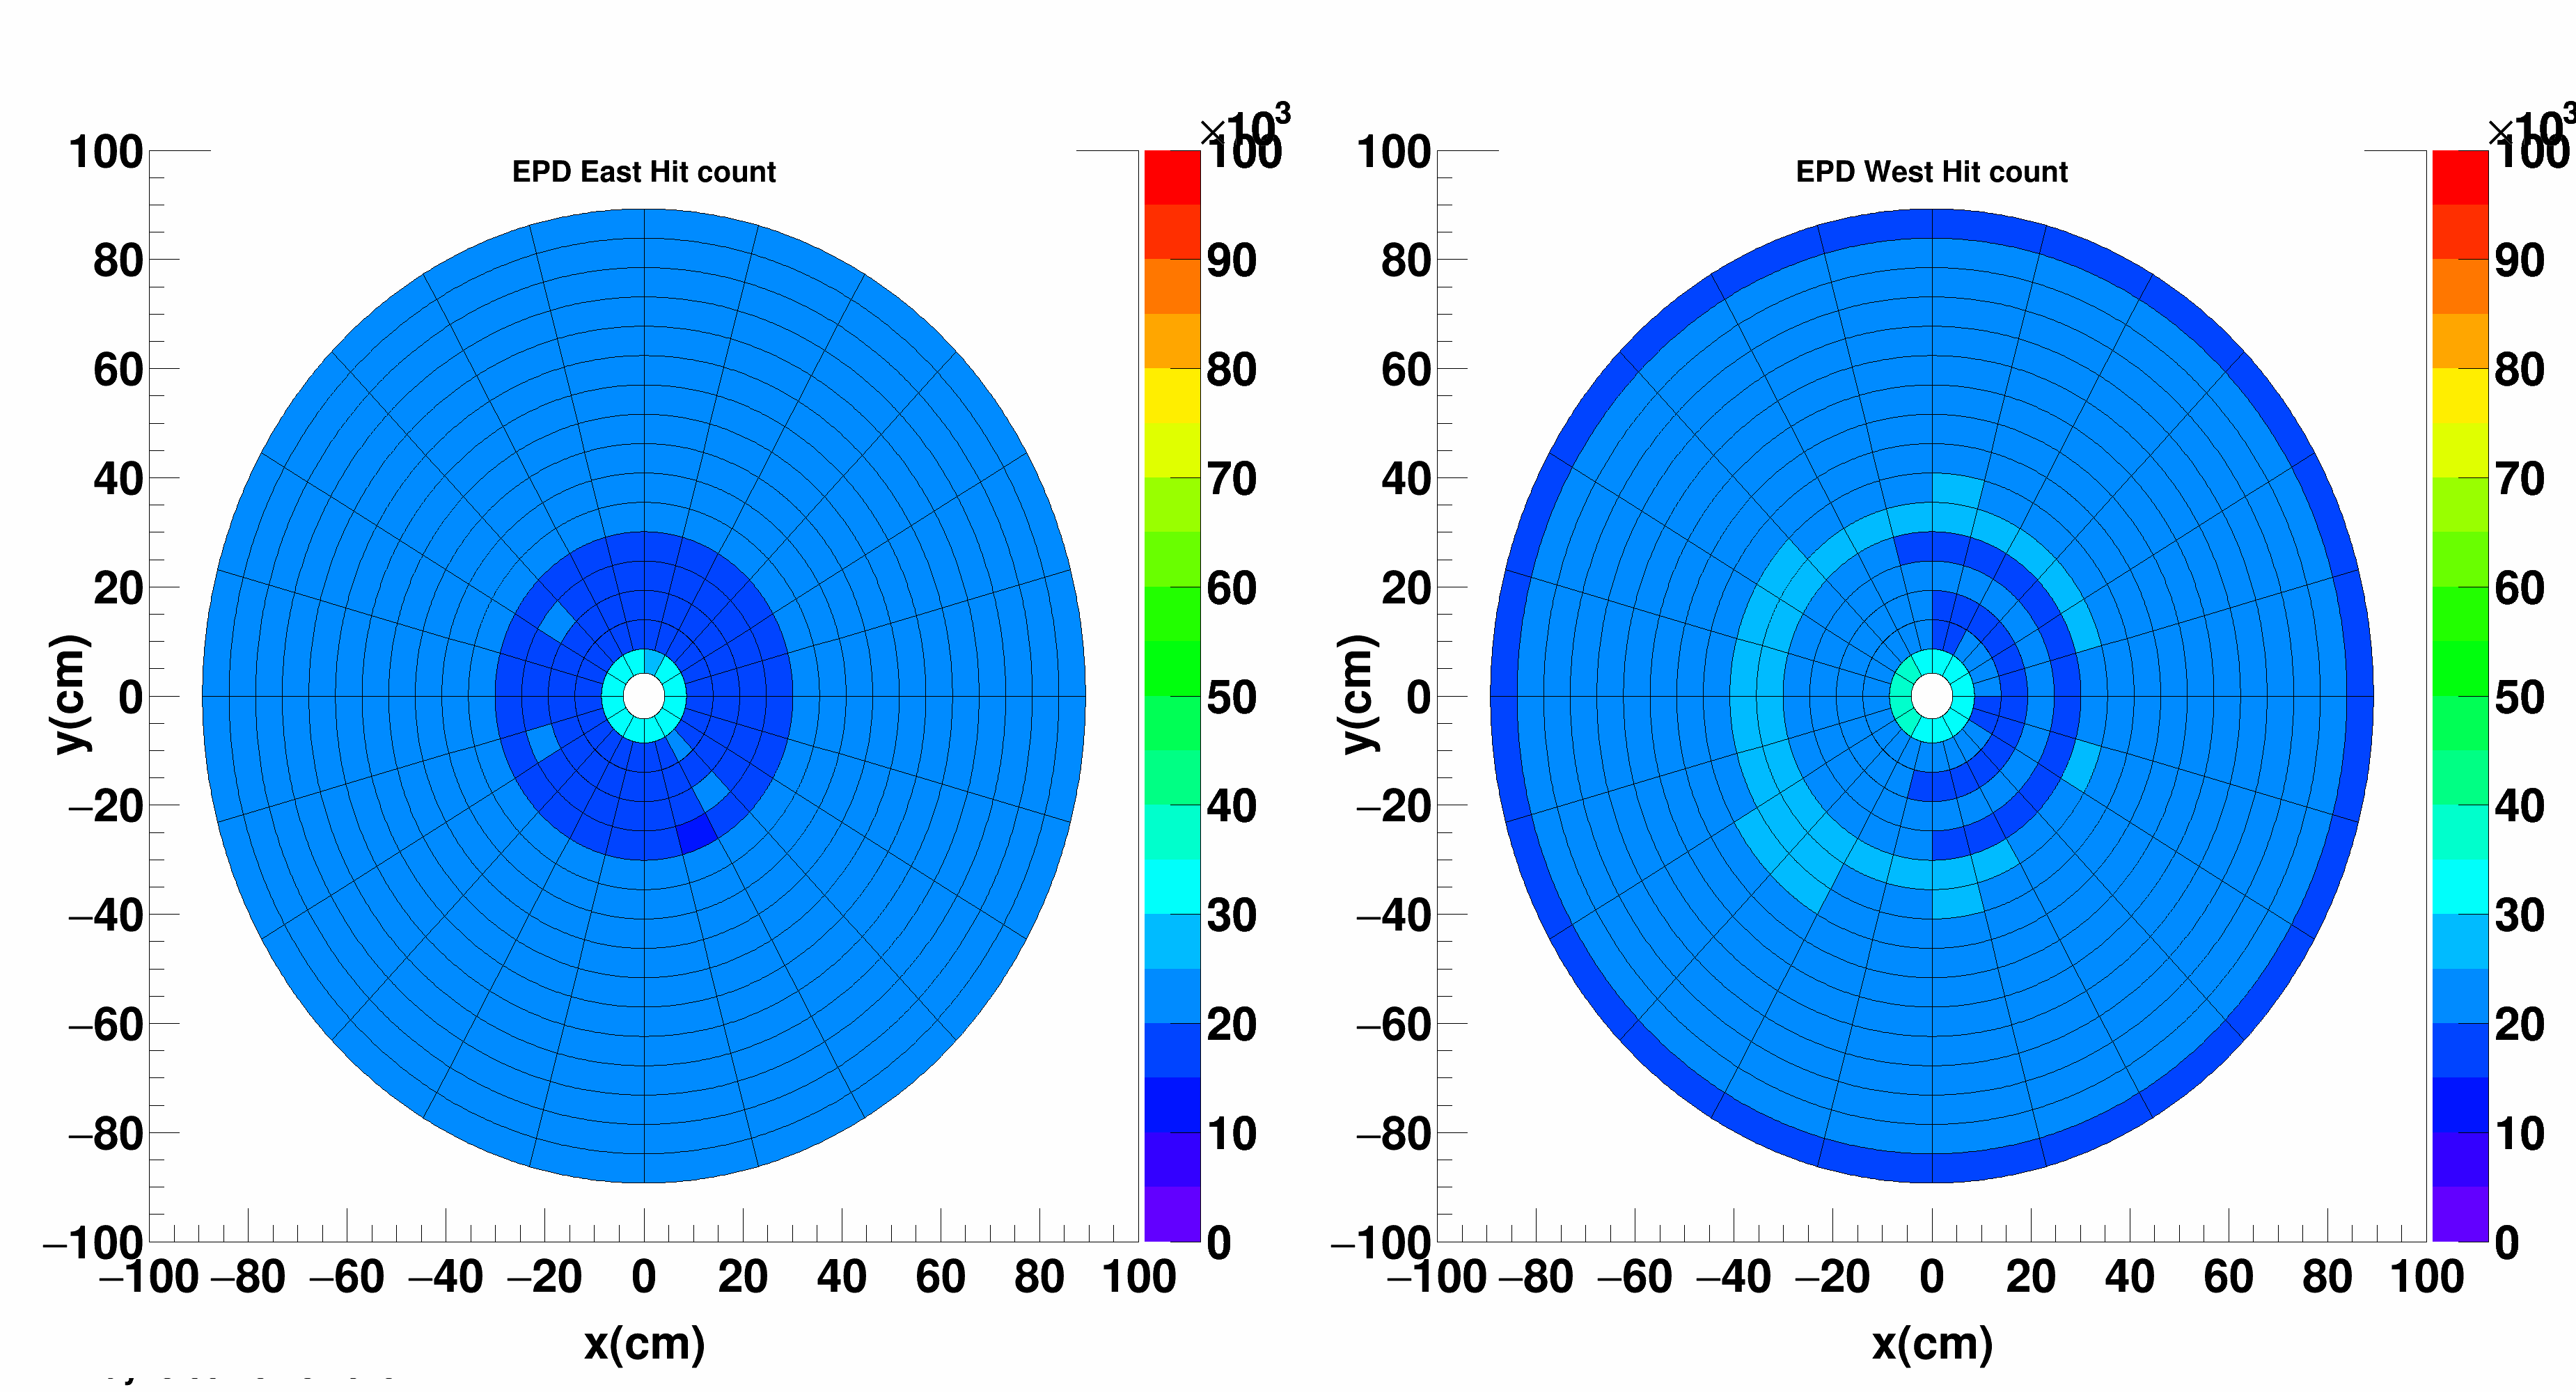
Figure 3: Hit maps for run 20123002.
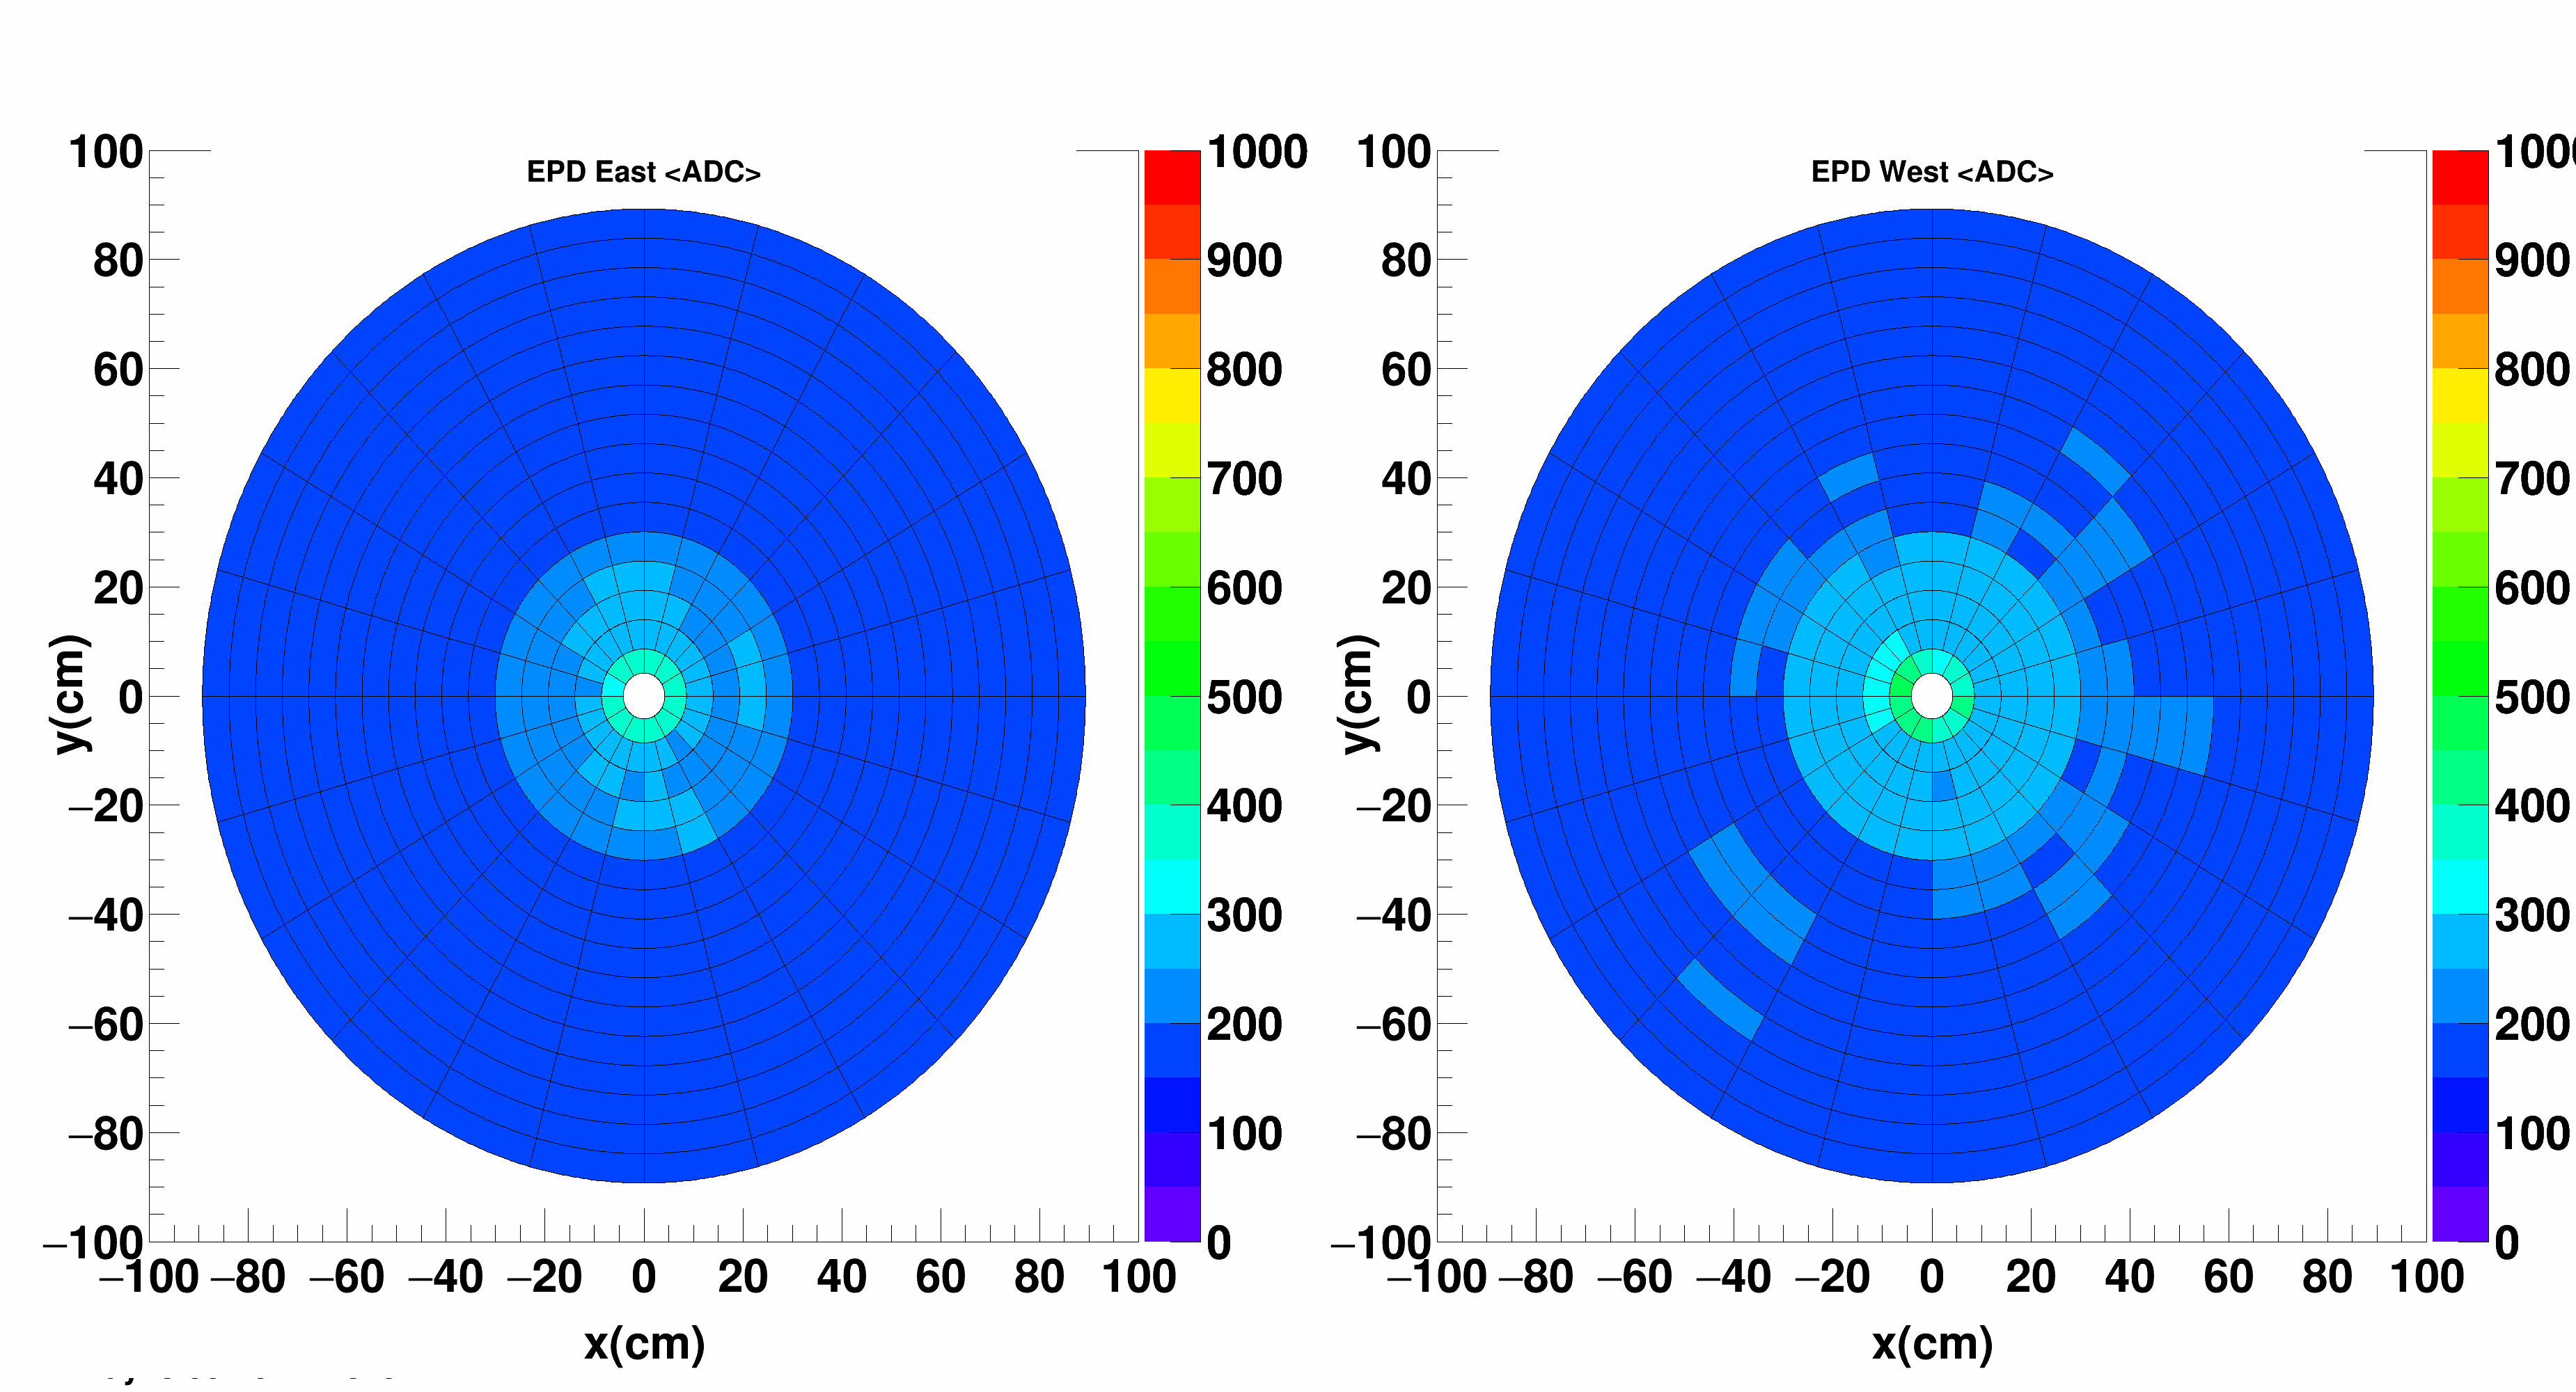
Figure 4: Average ADC for run 20123002.
The three channels are:
EPP2TT27 - Cr2Bd0x10Ch11
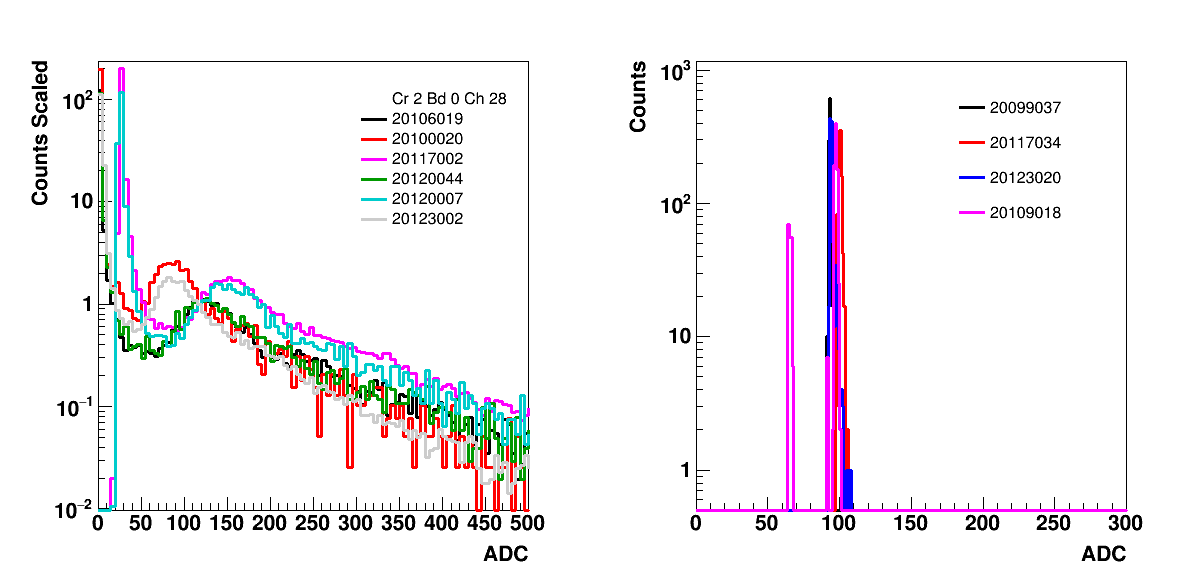
EPP3TT28 - Cr2Bd0x10Ch20
EPP4TT28 - Cr2Bd0x10Ch28
It was noted that all 3 channels were on the same board, which happened to be the board where we uploaded the new QT32B algorithm on day 105. (This is going from v6.4 to v7.0a which allowed the QT32B to participate in the trigger decision.)
One thing that should be noted is that while the <ADC> is low, the number of hits is large. This is calculated as the number of times a tile has an ADC above 16, which is particularly low. What this indicates is that a lot events had a low but > 16 ADC. This can be better seen in the ADC spectra:
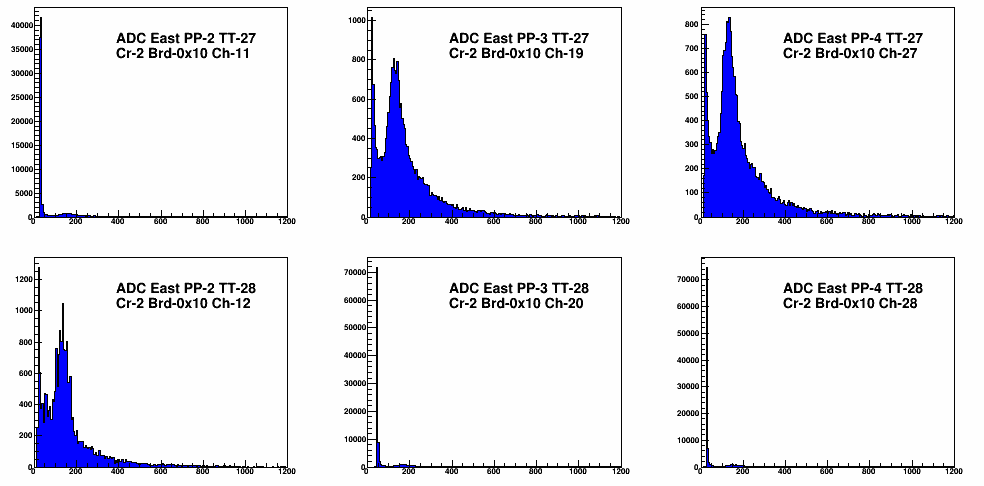
Figure 5: ADC spectra for 6 tiles, 3 of which show the issue. These are from run 20117002.
What we can see here is that the signal itself in the first MIP peak is roughly the same as in the other tiles, the peak at low ADC is very high. This leads to a low <ADC> as this peak is averaged in, but since it is greater than ADC = 16 the number hits is very high. It looks like the wrong pedestal was subtracted.
This prompted us to look at the pedestals. A pdf of all the pedestals since the start of beam can be found at:
drupal.star.bnl.gov/STAR/system/files/EpdPed_05032019.pdf
This has shown us a lot of interesting issues. Lets first look at a QT32B board that is not in this crate at all and has a solid looking mean pedestal.

Figure 6: This is a plot of the mean ADC with the sigma as the error bar for the QT32B board in crate 1, board 0 (0x10) and channel 1. We can see that the sigma is less than 1 ADC count and that the average itself only varies by 1 or so ADC. Each line represents a different day, starting at day 56 and going to day 123. The red lines show the time period where the new algorithm had been loaded in, but this should not have effected this board. This board corresponds to West PP1 TT24.
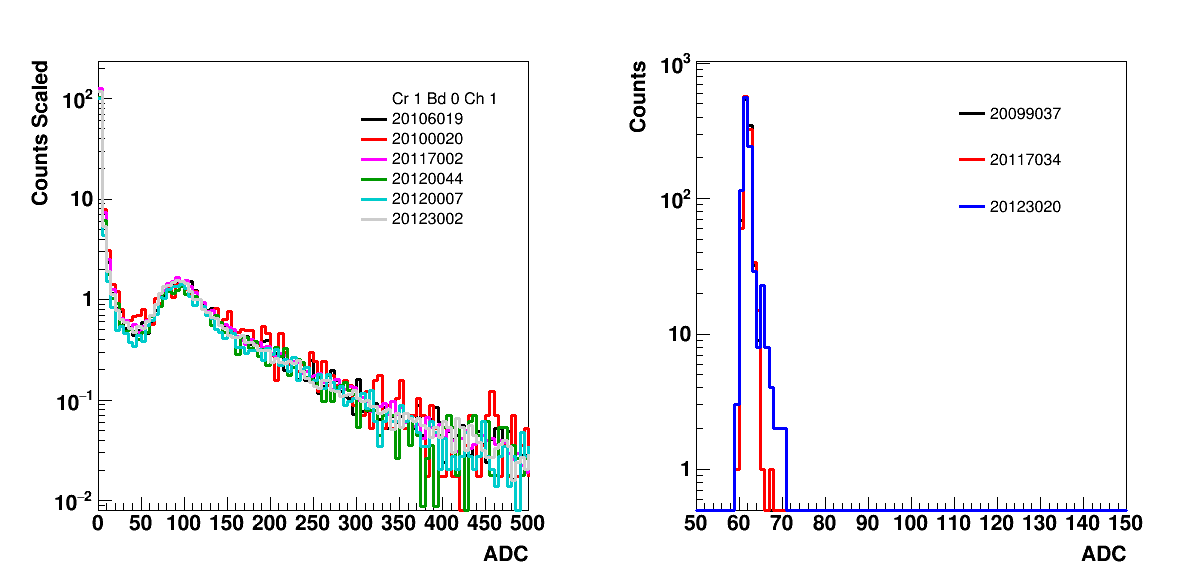
Figure 7: The ADC spectra and pedestals from the QT32B board in crate 1, board 0 (0x10) and channel 1. Since the algorithm change was made on day 105 this spans the entire data structure.
Next we will look at a channel on the board that had the new algorithm loaded in, but didn't show the "cold" tile behavior.
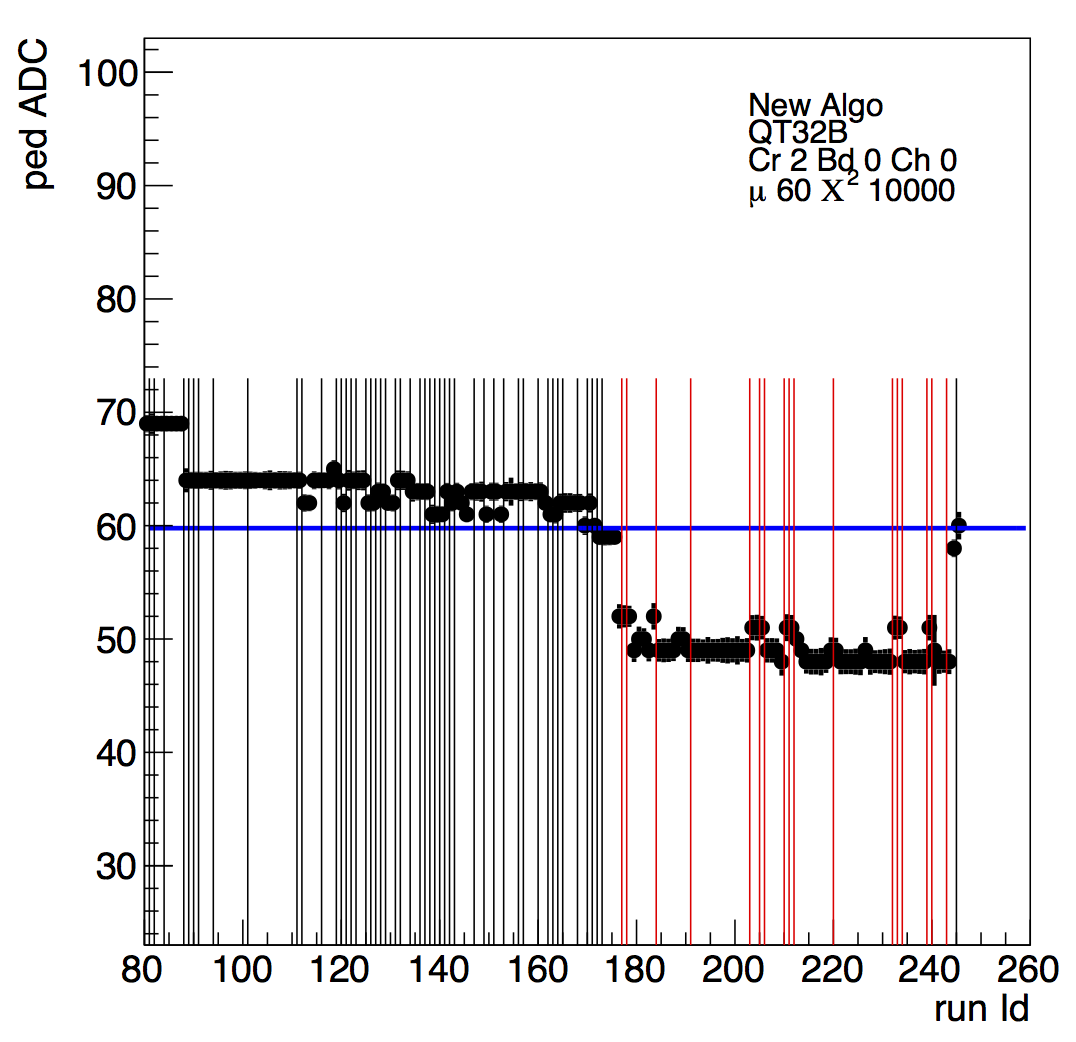
Figure 8: The mean pedestal for the QT32B board in crate 2 board 0 (0x11) channel 0. This corresponds to East PP1 TT24. The change in the value of the pedestal is a little strange in that it indicates something about the noise level changed. But that can also be fine if the pedestal is solid and that is indeed the noise level of this particular channel at that time.
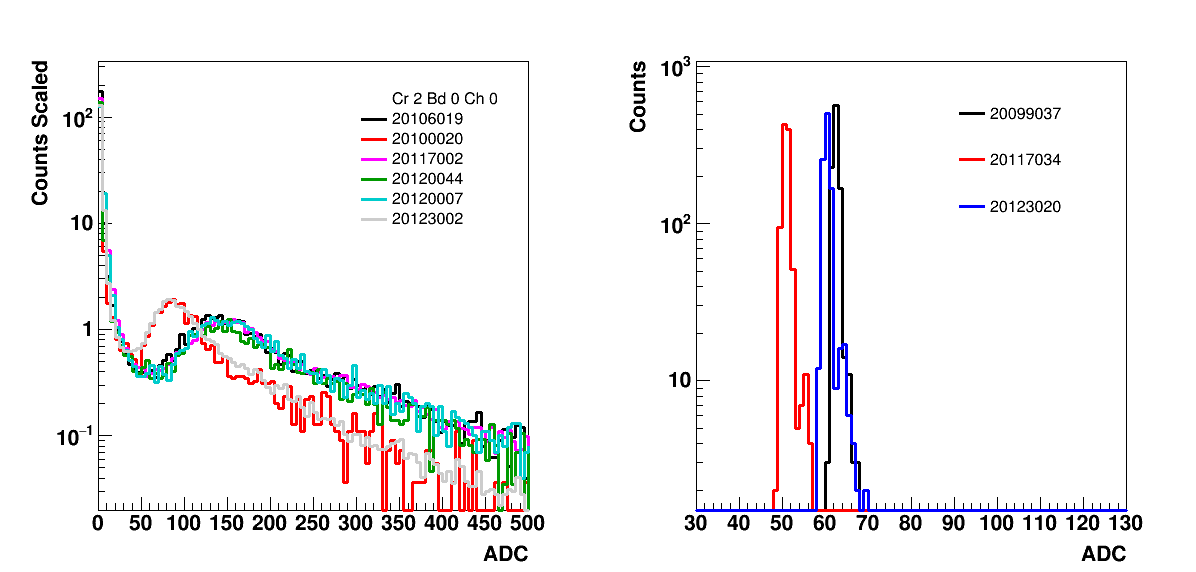
Figure 9: The ADC spectra and pedestals from the QT32B board in crate 2, board 0 (0x10) and channel 0. The algorithm change was made on day 105.
In figure 9 we see a few things, one is that the v7.0a algorithm (the new algorithm) had a higher apparent gain.
From a mail from Eleanor:
I checked the later tabs named "DCM_Phase_Shifts_2" and "Short Signal
Width_2" where Steve was testing the effects of changing the DCM
PHASE_SHIFT attribute. In both cases the ADC values using the final
phase shift setting of -32 were a factor of 2.3 (230%) larger than the
values obtained with the original setting.
So, if you are comparing old v64 data to the new, fixed v7a data I
would expect that the new ADC values to be 0.6*2.3 ~1.4 times larger
than the old v64 values, i.e. I would expect a 40% increase in the ADC
values.
For this tile, the value of the MPV shifted from 90 to 140 which is about 55%, a little larger but perhaps inline with the discussion above. Regardless, this is not an issue, the ADC value can certainly switch. We see for this tile the ADC spectra are pretty solid and that the form doesn't look different from the early to late run, and the runs taken with the new algorithm are also similar to one another.
The width of the pedestal also seems very similar, simply shifted downwards in the runs done with v7.0a.
.png)
Figure 10: The ADC spectra and pedestals from the QT32B board in crate 2, board 0 (0x10) and channel 11. The algorithm change was made on day 105.
In this channel we can see the offset, but also that the error bars are quite large. This indicates the sigma on the pedestal distribution is much larger than the less than 1 ADC distribution that is common.
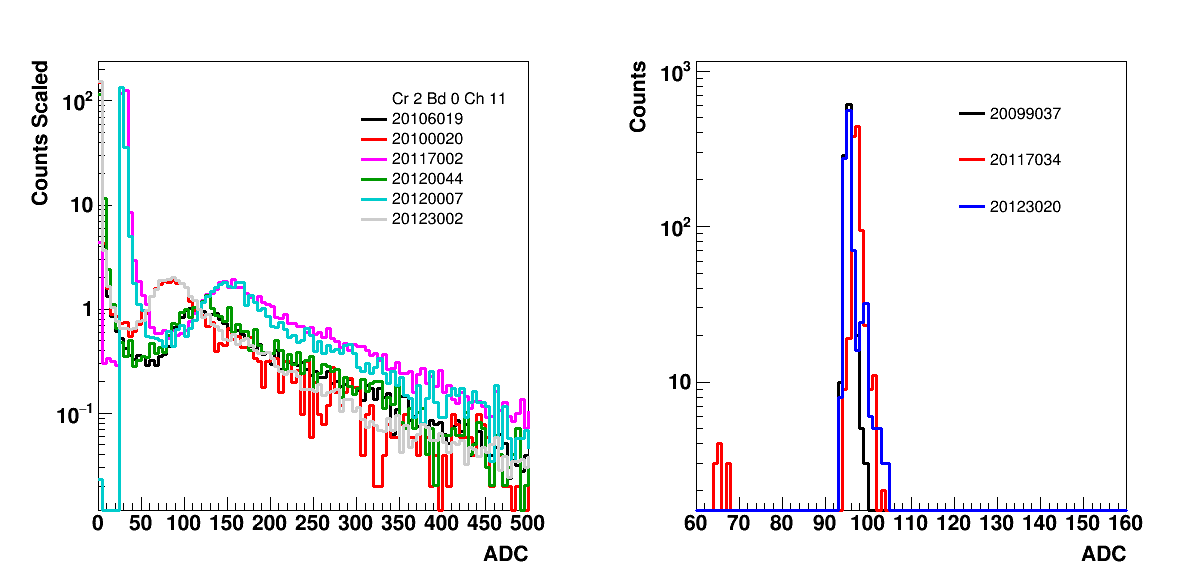
Figure 11: The ADC spectra and pedestal for crate 2, board 0 (0x10) channel 11.
We see the issue here is that the spectra are shifted by about 25 ADC. This means that these tiles would continuously fire, as we have defined a hit as ADC > 16. But most of the "fires" will be of low ADC, making <ADC> seem low. The MIP peak went from 85 to 155.... If we assume that 25 of that is the offset, then the difference would be from 85 to 130 or also about 52% larger.
We see a strange bimodial distribution in the pedestals that was not seen in the other channels. This leads to the large sigma. The mean is 96 in this run, which is a lot higher than the 68 or so that one reads off of the chart. (Ok, I have checked, I picked one of the runs where it fluctuated high....)
And this run doesn't really show the bimodial distribution in the other two channels, see below. I will look at another run.

Doing so gives me the following results:
- rjreed's blog
- Login or register to post comments