EPD Cosmic Test 1
Executive Summary:
Some events had a high signal in a large number of channels. I have discarded these (a small fraction). 21% of all events had at least 1 hit in the 3 trigger channels in the supersector near the trigger detector. Only 3% of events have at least one hit in the 3 trigger channels in the far trigger detector. This is a harsher cut than is necessary. It would bring the rate from 4 Hz to 1/10th a Hz. We can probably double this with a relaxation of the cut.
There seem to be signals in "higher" channels when a real signal hits ch 15-19. I am not sure what that is at the moment.
Of the events that have at least one hit in trigger ch 15,17,19 in far SS05, about 11% did not have any hits in near SS06. This seemed higher than I thought. If there is hit, it is essentially within ch 13,15,17,19,21 in SS06, so the cosmics selected were mostly straight as expected.
Does this mean a ~11% inefficiency?
Analysis
We want to use cosmics to test the efficiency of the EPD tiles in each SS. The problem is that if we use a coincidence between 2 trigger detectors with EPD tiles in between, it will take far too long. A distance of one super sector is reasonable (~1 Hz), but that would take a long time as the detectors only span ~2-3 channels. If we stack several supersectors, the rate drops to 1/10 Hz or less, which would also take a long time. So the idea was to use one trigger detector with a stack of EPD supersectors, and use the outermost as an offline trigger.
The set-up for the first test is detailed at:
drupal.star.bnl.gov/STAR/system/files/EPD2017_test.pdf
It can be seen at:

Figure 1: Test Set up
This resulted in 46,822 triggered entries.
First I looked at the ADC spectra in SS05 (odd only):
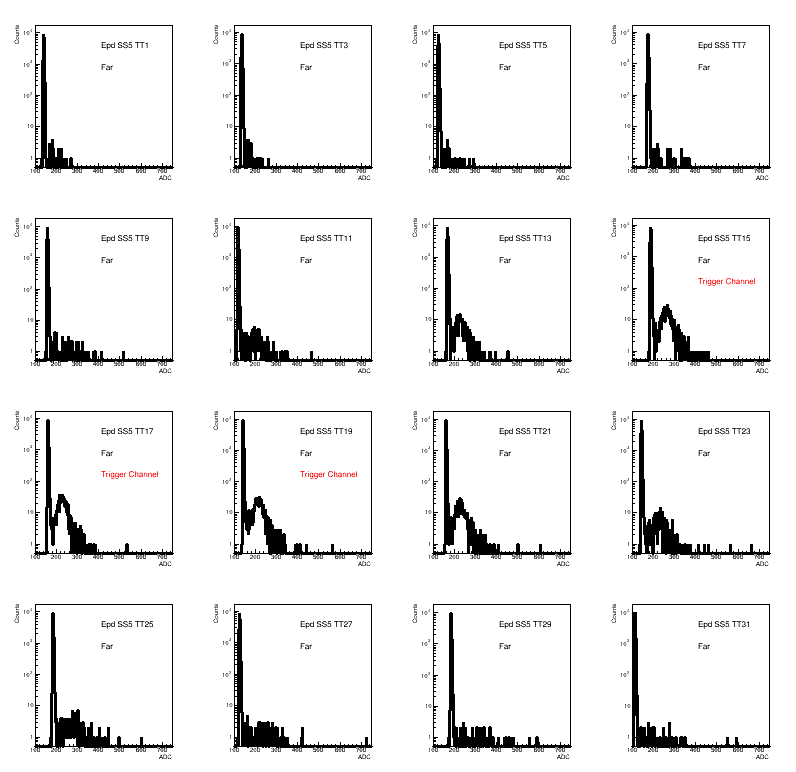
Figure 2: ADC Spectra SS05, the "far" SS.
And in SS06 (odd only):
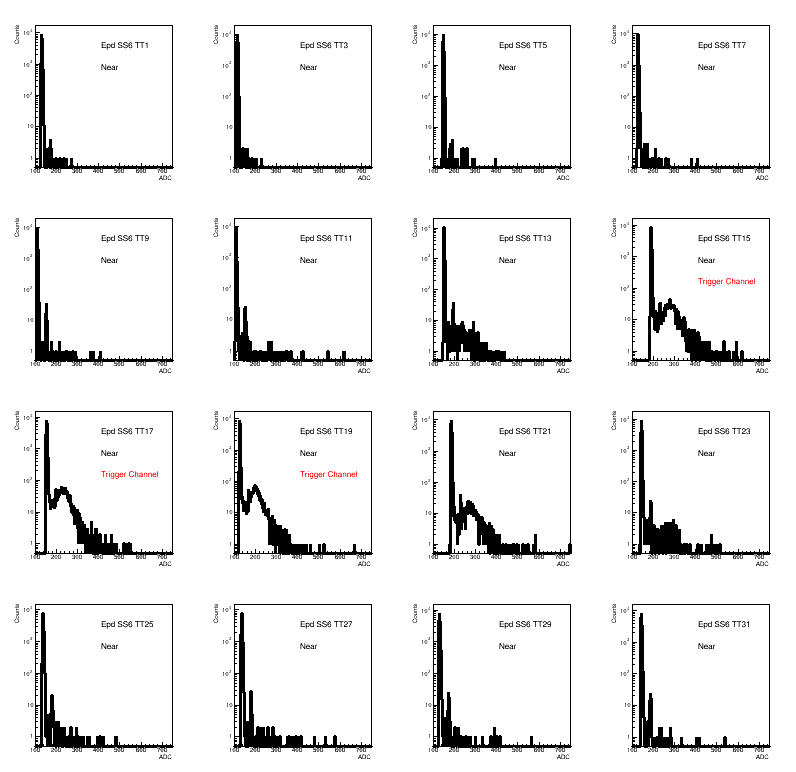
Figure 3: ADC Spectra SS05, the "near" SS.
In order to analyze the data, I chose thresholds for all channels, which can be seen in:
drupal.star.bnl.gov/STAR/system/files/EpdAdc_08032017.pdf
One check was to see how many channels in both super-sectors had hits (based on this analysis):
Note: I am assuming that channels can either be 0 or 1.
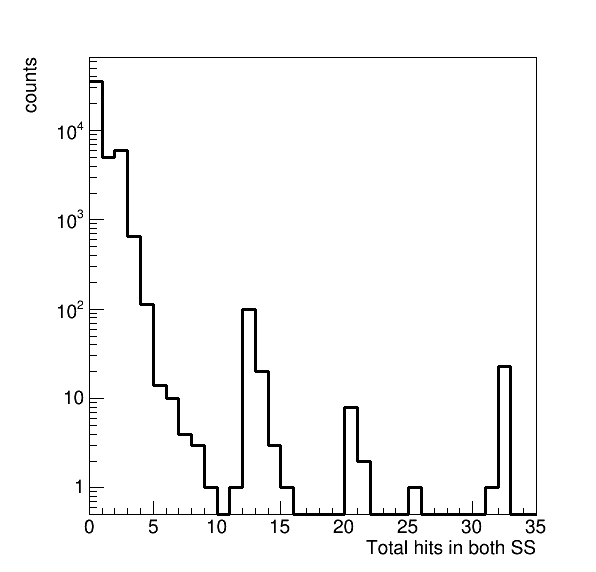
Figure 4: Total number of hits in both SS, the assumption is anything that results in more than 10 hits in both SS is problematic.
Ok, so for some small amount of events, something really weird has happened. So now I am going to only analyze events with less than 10 total hits in both supersectors under the theory that these represent some strange issue with the DAQ.
Looking at all events and totaling the number of times each channel had a hit, we see:
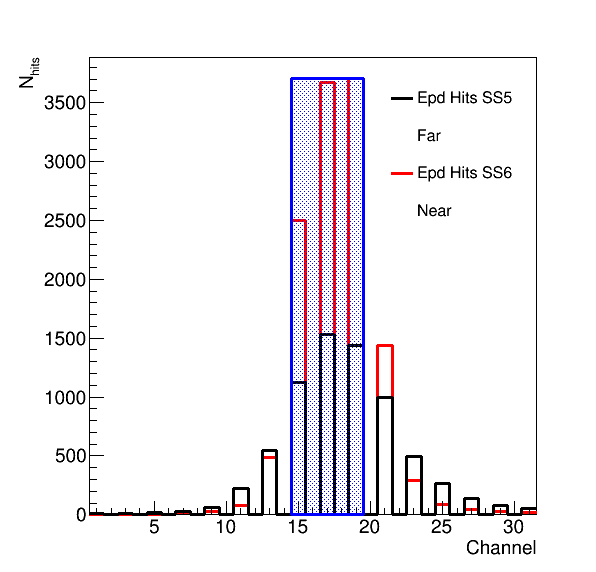
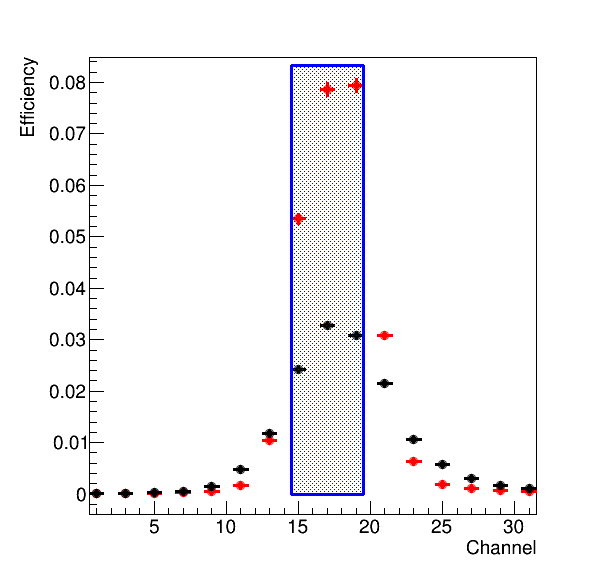
Figure 5: (L) Number of hits in a given channel. (R) The left distribution divided by the total number of triggered events.
The blue block indicates the trigger detector locations. As expected, there are far more hits in the SS near the trigger detector than there is for the one that is far away. Still, there weren't that many hits, I had expected a higher efficiency. Looking at:
9870 with at least 1 hit in ch 15, 17, 19 in near ss06
21% of events
1440 with at least 1 hit in ch 15, 17, 19 in far ss05
3% of events
This is probably too restrictive ... what we want to do is make sure that there is a cosmic ray and it had gone through the inner detectors. It's ok if it is at somewhat of an angle (this will shift the mip peak, but probably not a lot), so I may look in this data to see what happens if I pick 13, 15, 17, 19, and 21 in the far SS (06).
First I can look at some correlations:
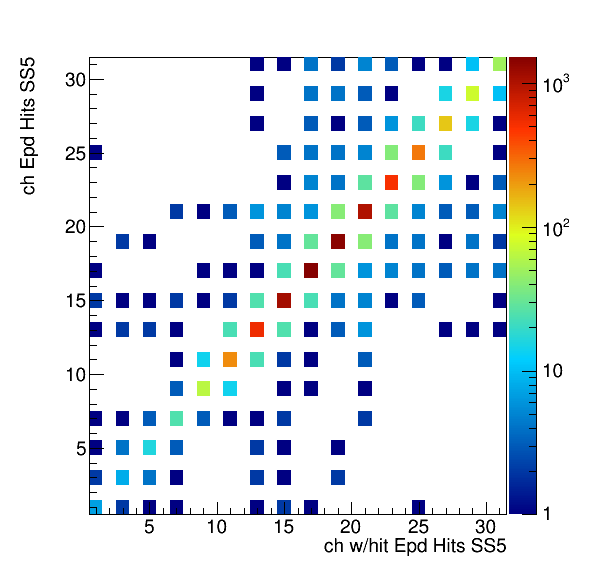
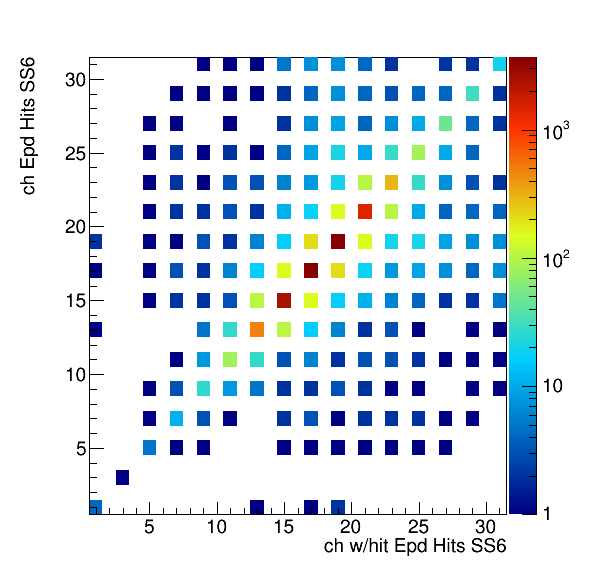

Figure 6: (L) Correlation map of hits in SS5 channels (M) Correlation map of hits in SS6 channels (R) Correlation map of hits in SS5 vs SS6 channels.
On the left plot, this is the correlation between channels in SS 5 versus other channels in SS 5. (Basically every entry comes from having a 1 in both channels.) The middle plot is the same correlation for SS 6. The right plot is the most interesting, it shows hits in channels from SS05 if there are hits in SS06. Note that the left and middle plots are symmetric about the diagonal by construction.
I can project the histogram on the right, getting:
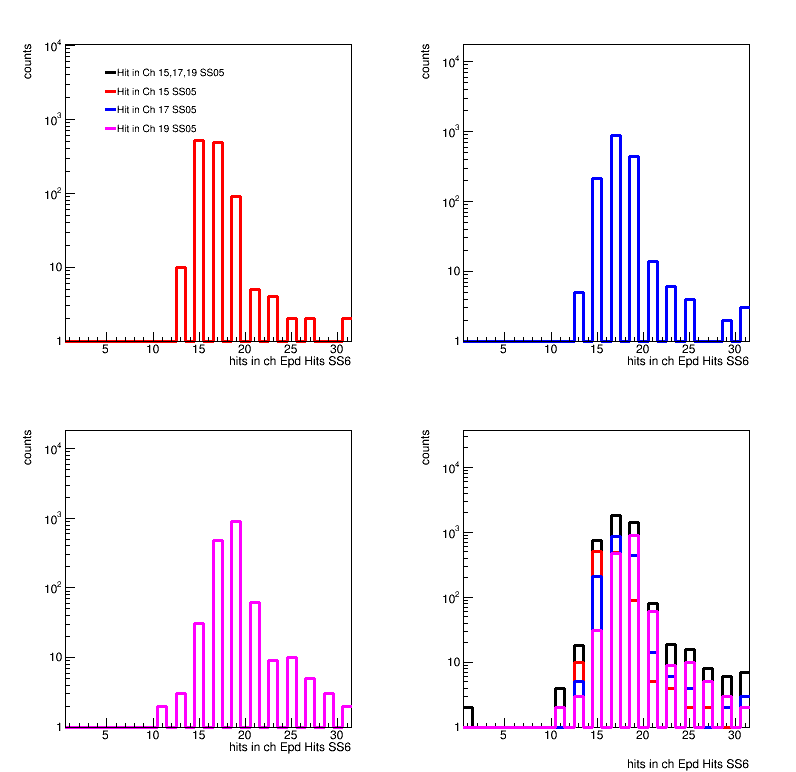
Figure 7: Projections of Figure 5 right plots, for one channel (15 in the upper left, 16 in the upper right, 17 in the lower left) and in black the projection for all 3 trigger channels. There will be some double counting.
This shows the distribution of events with a hit in SS05 channels 15, 17, or 19 from the projection of the 2D plot. What is surprising to me is the asymmetry in the distribution.... I will think about this further with sleep and coffee. (One thing to check are events with a hit in say ch 17 in both SS, and see what is happening in the other channels..... To look for cross-talk.
The question is, how often is there not a hit in SS06 when there is a hit in SS05? This should represent an efficiency.....
First I looked at the 1440 events that have at least one hit in SS05 ch 15, 17 or 19.
of these only
162 did not have a hit in ss06 (11.3%)
163 did not have a hit in ch 11,13,15,17,19,21,23 in ss06 (11.3%)
166 did not have a hit in ch 13,15,17,19,21 in ss06 (11.5%)
214 did not have a hit in ch 15,17,19 in ss06 (15%)
Do these make sense?
- rjreed's blog
- Login or register to post comments