EPD Cosmic Test 3
The cosmic test stand set-up for this analysis can be seen at:

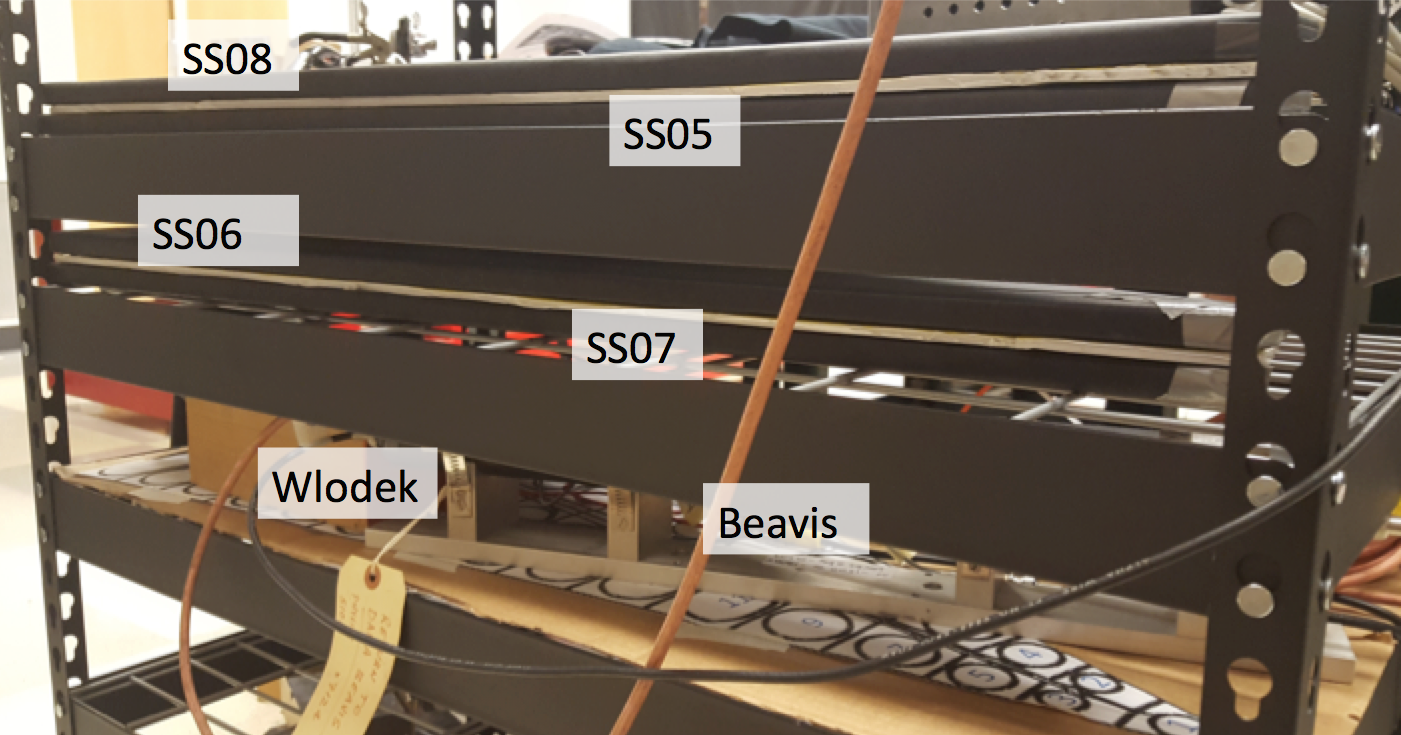
Figure 1: Cosmic test stand at OSU
The plan is to use Beavis/Wlodek paddles as the online trigger. However, this can still select events where a cosmic did not go through all 4 SS. So in addition to this, we will use the outer SS as offline trigger.
First, the thresholds needed to be determined, we can see them in:
drupal.star.bnl.gov/STAR/system/files/EpdAdc_08122017.pdf
Note: the distributions above are only for good events, when no selection on event quality is made, they look like:
drupal.star.bnl.gov/STAR/system/files/EpdAdc_08102017.pdf
It should be noted here that TT1 is not hooked up, and this is only the odd channels. But, it seems there is a reasonable MIP signal in each of these channels.
An example is:

Figure 2: ADC spectrum with threshold for SS8 TT 25. (Note, this was for good events only...)
One we established the thresholds, we can look at the number of hits in a SS:
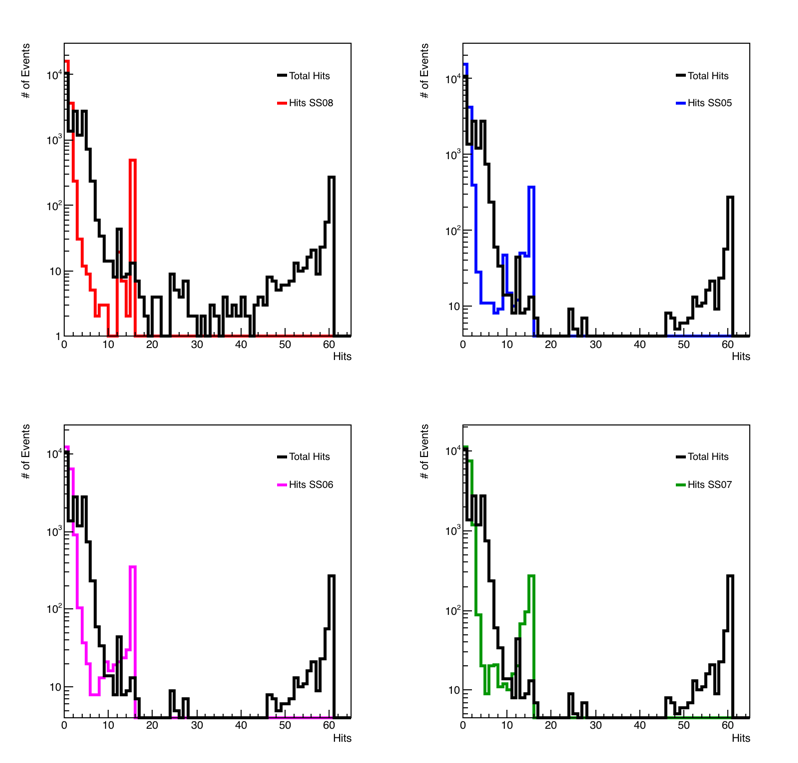
Figure 3: The number of hits in a super sector.
The black histogram is the sum of hits in all 3 supersectors. The colored curves represent the number of hits in each individual SS. (The order is always furthest from the trigger to closest in the order of UL, UR, LL, LR).
Only those events with at least 2 hits, and no super sector with more than 5 hits were used.
Next, in order to look at efficiency and cross talk, I looked at events that only had one hit in the top and bottom supersectors. (Explicitly only one hit .. selecting against showers, and cosmics that were at an angle).
The number of good events, out of the 65,770 triggered events taken at OSU in this configuration can be seen in:
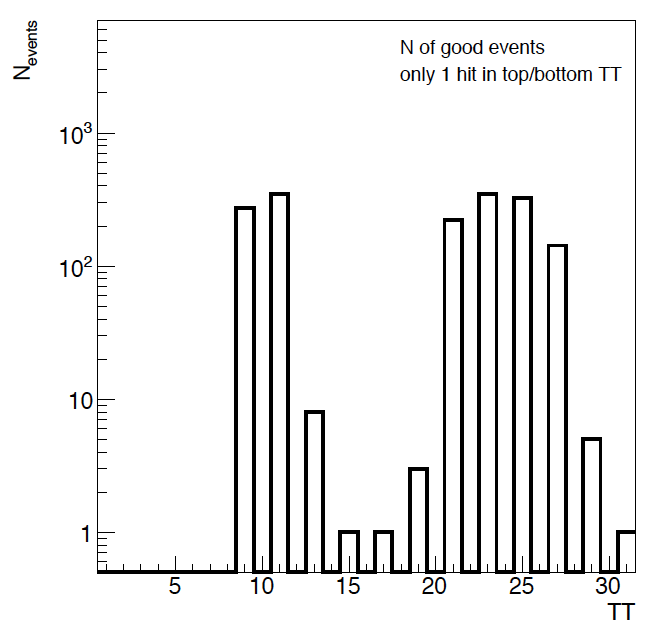
Figure 4: Number of events with only one hit in a given tile in the top and bottom SS.
I will only analyze tiles with at least "good" events. We see here that we could probably get away with recording 35k - 40k per configuration.
An example can be seen at: (TT = 21)
.png)
Figure 5: Hit distributions for "good" events in TT 21.
The left plot shows the hit distribution of the two middle super sectors in red and blue. The black histogram shows the number of good events in the analysis. We can see hits outside of the expected channel, I will look to see what happens if I raise the thresholds a tiny bit. The middle plot repeats the histogram of good events, the red and blue show the number of times there was not a hit registered in the given super-sector. The miss rate in this channel is less than 1% for both. The right plot shows the hit distribution for events where there were at least 2 hits in the given super-sector.
The summary of all 6 tiles in the 2 super sectors can be seen at:
drupal.star.bnl.gov/STAR/system/files/CrossTalkVert_08122017.pdf
The summary for these 6 tiles is:
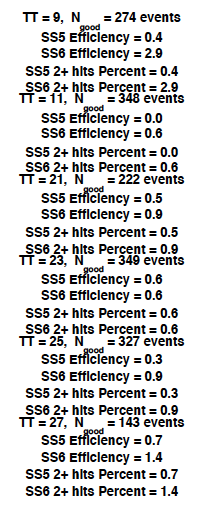
Figure 6: Summary of the performance.
The efficiency is above 99% for all of these tiles. The double hit percentage is low, indicating that cross-talk is at the level of a percent or so.
I adjusted the thresholds to be a little higher, with the following results:
drupal.star.bnl.gov/STAR/system/files/EpdAdc_08122017_change.pdf
drupal.star.bnl.gov/STAR/system/files/CrossTalkVert_08122017_change.pdf
Looking at the same tile, we see:
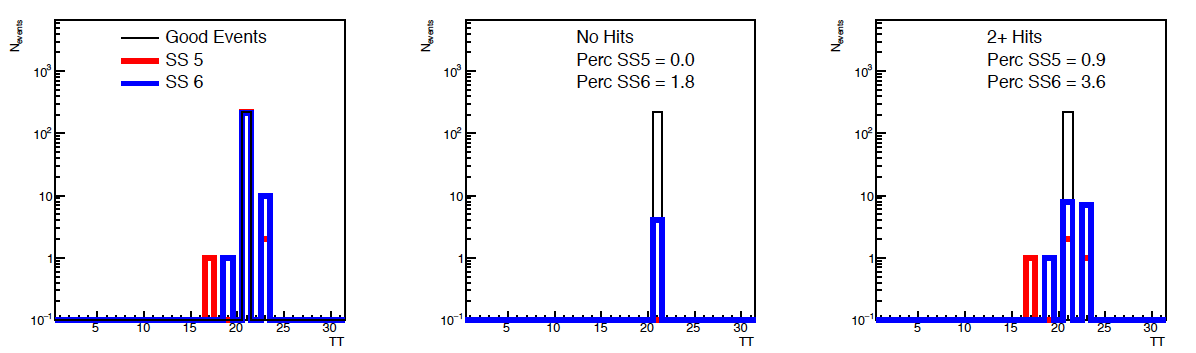
Figure 7: Hit distributions for "good" events in TT 21 after changing thresholds.
Note that this won't be precisely a subset of the earlier events, as an increase in threshold could add events that had 2 hits in the same SS in the top or bottom SS, and now this reduces them to 1.
- rjreed's blog
- Login or register to post comments