EPD SS08 TT 5
Executive Summary: SS08 TT5 looks weak.
We moved the trigger paddles underneath the low number odd tiles so that we have enough statistics in them to make a decision. Additionally, we rearranged the electronics so that we were able to measure signals in tile 1 in all 4 super-sectors. (We can look at 4x15 channels, not 4x16.)
The summary of the adc in this configuration only is at:
drupal.star.bnl.gov/STAR/system/files/EpdAdc_odd3_08232017.pdf
What I noticed was that the signal in tile 5 of super-sector 8 looked off. For instance, comparing it to tile 5 of super-sector 5 which is directly below it:
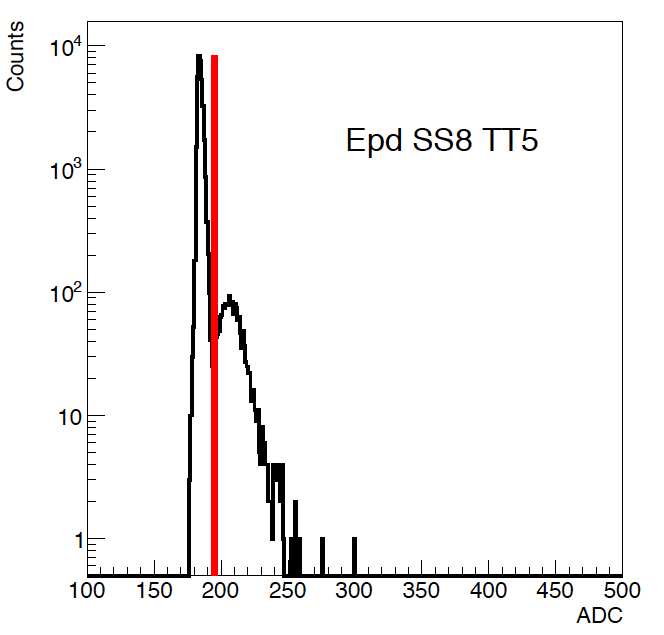
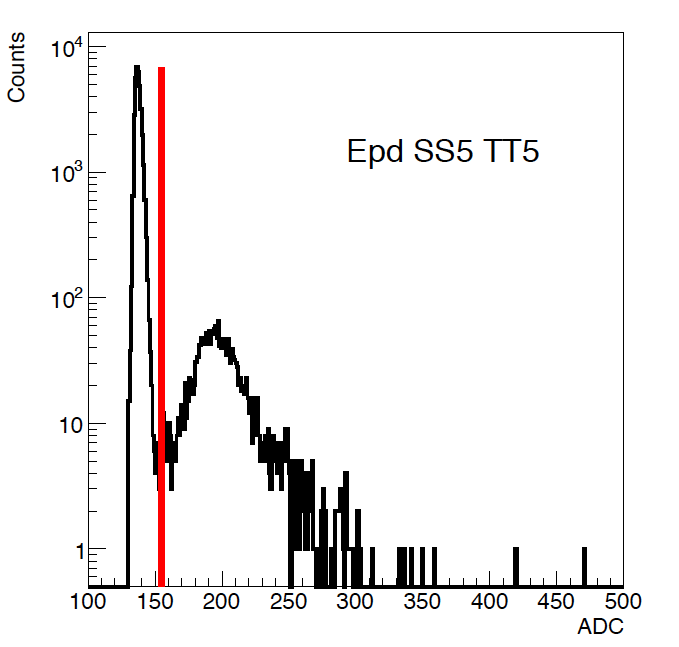
Figure 1: On the left is the ADC spectra for tile 5 SS 8, on the right is the ADC spectra for tile 5 SS 5, which is immediately below SS 8.
We can see that the MIP peak in SS08 TT5 is quite close to the pedestal, which indicates a gain problem of some sort. All the other tiles have a well separated MIP peak. One can ask whether it is the electronics or the detector, and for this we want to compare it to tile 4, which is read out with the same SiPM and adc channel. We can also look at the vertical only cosmics, in order to select events with real cosmics that are going through roughly the same amount of scintillator.
First, we will look at it compared to the tiles on either side:
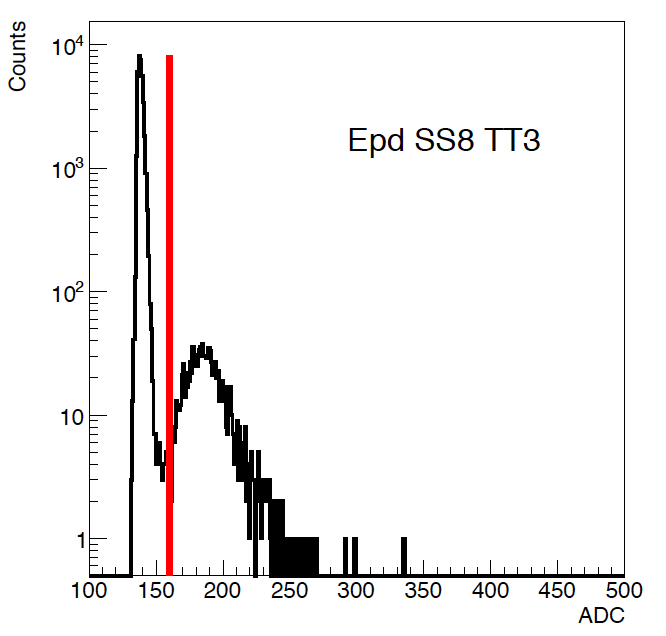

Figure 2: The 3 odd tiles that are next to each other in SS 08. Both TT 3 and TT 7 have a reasonable separation of the MIP peak from the pedestal.
The summary of the vertical cosmics can be found at:
drupal.star.bnl.gov/STAR/system/files/AdcSpectra_SS8_odd3_08232017.pdf
drupal.star.bnl.gov/STAR/system/files/AdcSpectra_SS5_odd3_08232017.pdf
drupal.star.bnl.gov/STAR/system/files/AdcSpectra_SS6_odd3_08232017.pdf
drupal.star.bnl.gov/STAR/system/files/AdcSpectra_SS7_odd3_08232017.pdf
The order, from top to bottom, as before is: SS 8, 5, 6, 7 Trigger. For these files, the odd tiles come from the single configuration with the trigger detector underneath the small tiles, but the even values come from the summary of all the tiles. Unfortunately the pedestal drifted on a few channels, so we can't sum the odds together. (Probably we should be better about taking pedestal runs.)
First let's compare vertical cosmics in SS8 TT5 and SS5 TT5:
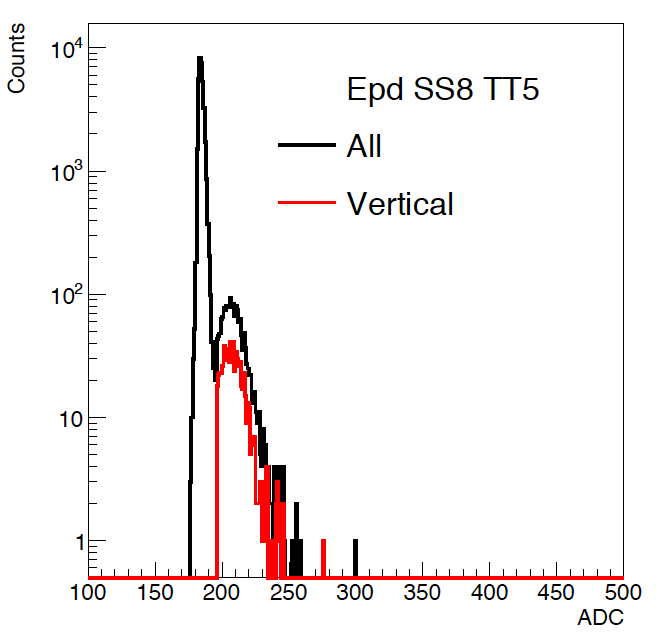
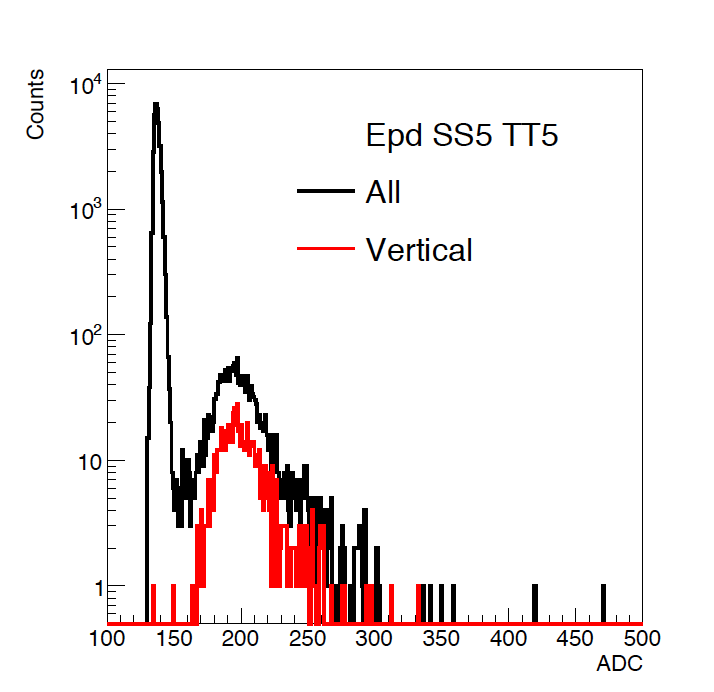
Figure 3: ADC spectra in black in SS8 TT5 on the left, and SS5 TT5 on the right. The red distributions are the ADC spectra for vertical cosmics.
Then compare vertical cosmics in SS8 TT3, 5 and 7:

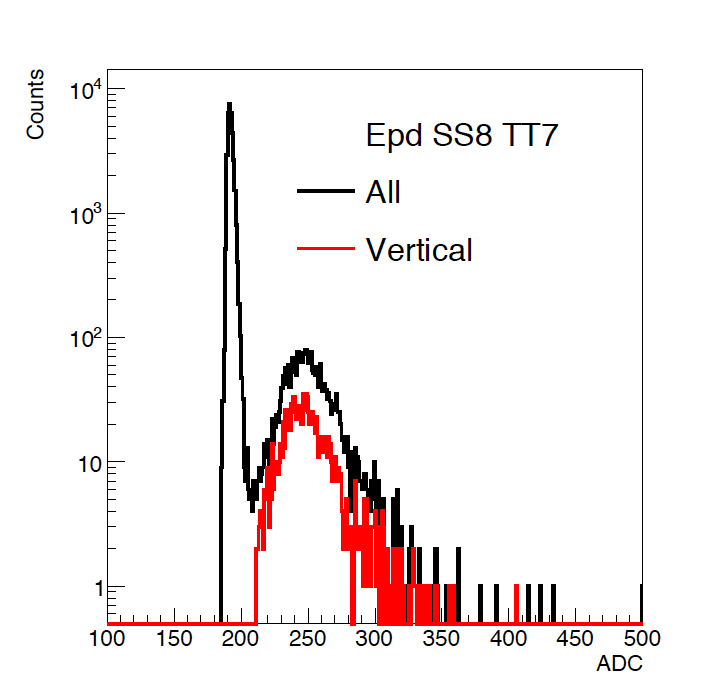
Figure 4: ADC spectra for SS08 TT3, 5 and 7 in black, and for vertical cosmics in red.
Unfortunately, since SS8 is being used as an offline trigger, the cut is visible in the red distribution in these plots. Hover, since SS7 is also being used, we can see that most likely the counts we see are true cosmics, that we just aren't getting enough light out. It should be possible to look at this using SS5 and SS7 as offline trigger detectors, so that we can see whether the peak in the pedestal region is just simply higher.
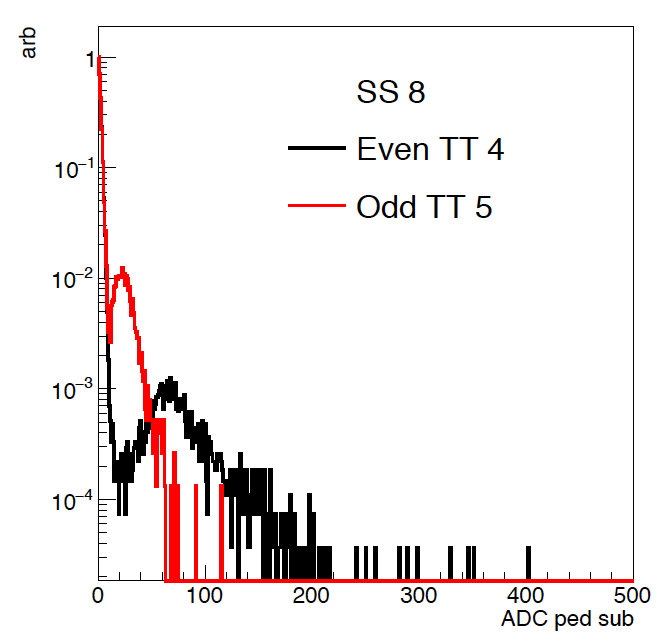
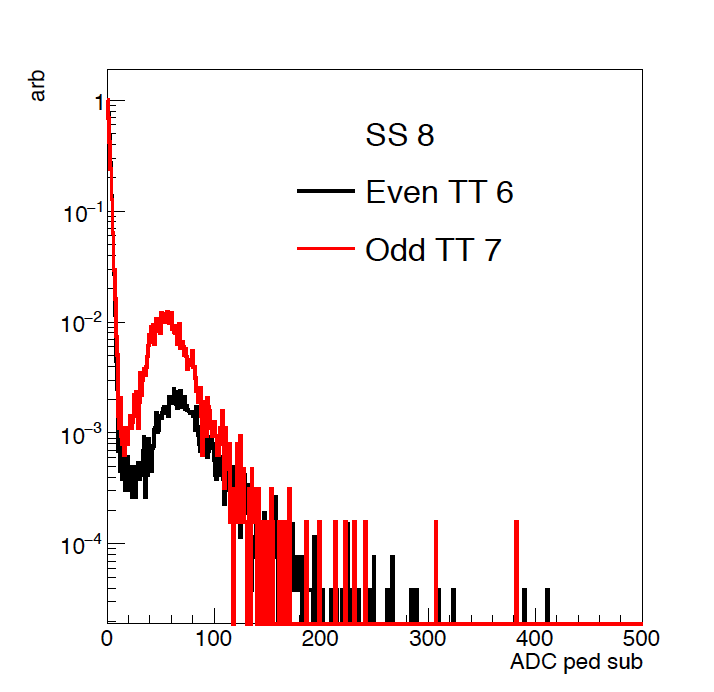
Figure 5: On the left is the distribution from SS08 TT4 and TT5, which were read out by the same SiPM and electronics. On the right is the ADC spectra from SS8 TT6 and 7 which were read out by the same electronics.
In Figure 5, we see that the distribution is not the result of the electronics (as the MIP peaks are not at all close), but the detector itself. Whereas for TT6 and TT7, the performance is relatively the same (as the ADC peak vs the pedestal is rounghly the same). The statistics will be different, and the ratio of pedestal to mip peak will be different depending on the exact location of the trigger detector. I normalized these by setting the maximum of the pedestal peak to adc = 0 and dividing by that value, as the pedestal had drifted a little.
In Figure 5, there was a question of whether the overall gain was reduced, which could cause this issue. This would also result in a narrowing of the pedestal, so the figure was zoomed into the pedestal region, and the normalization of the adc to 0 was removed. This can be seen below.
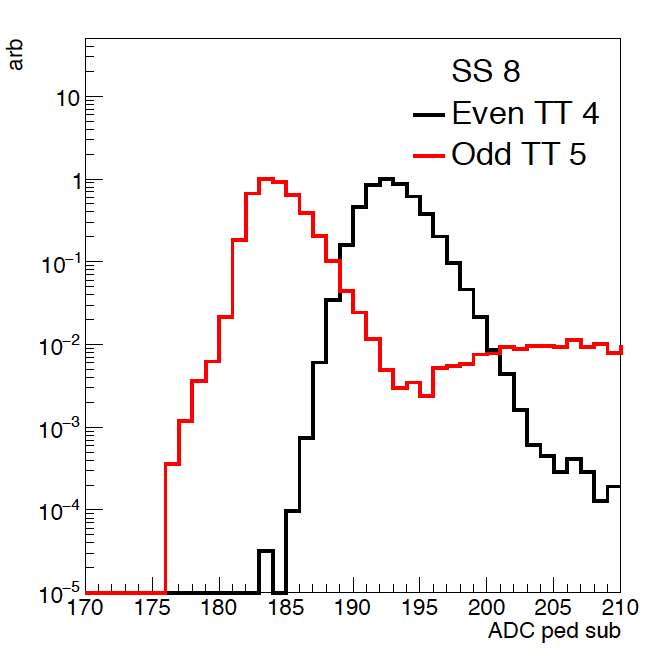

Figure 6: The same distribution as figure 5, zoomed in with the normalization of the ADC removed. As seen here, even though there was a shift in the peak of the pedestal, the overall width is the same.
Then there was the possibility that something was damaged. The data shown here for the odd distributions happen after we started with odds, switched to evens, and then switched back to odds again. The statistics were not great, which is why we returned to the odds in the first place, but we can see the comparison to what happened earlier below.
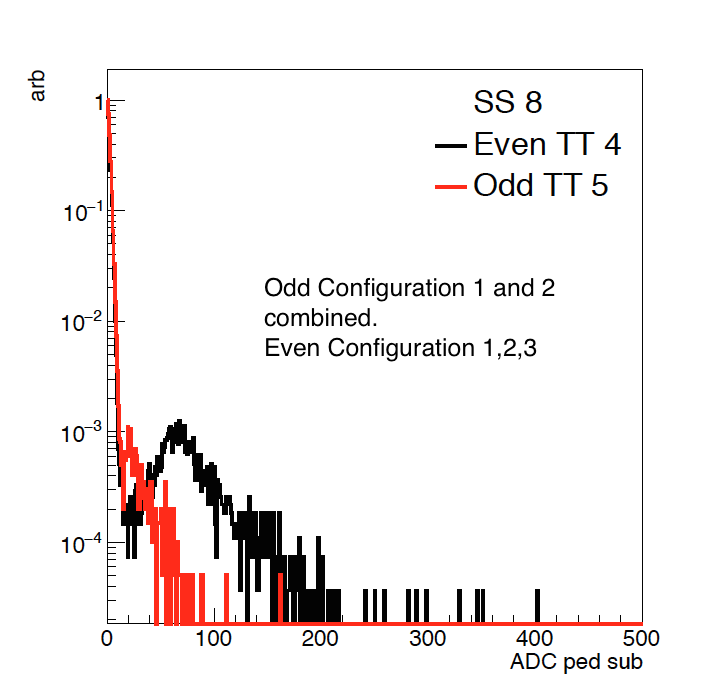
Figure 7: These are of the same distribution, but the red curve on the right side comes from the earlier data set (Configurations1 + 2) and the red curve on the left comes from configuration 3. The black distribution from the even tiles is the same in both plots, and comes from a summation of all the configurations.
From Figure 7 we can conclude the problem was there to begin with.
- rjreed's blog
- Login or register to post comments