EPD TAC Offsets Run 21 7.7 GeV
I followed the directions at: drupal.star.bnl.gov/STAR/blog/rjreed/tac-offset-files-epd
To start with, we were using the TAC Offset values from Run 20. This resulted in the following trigger distribution.
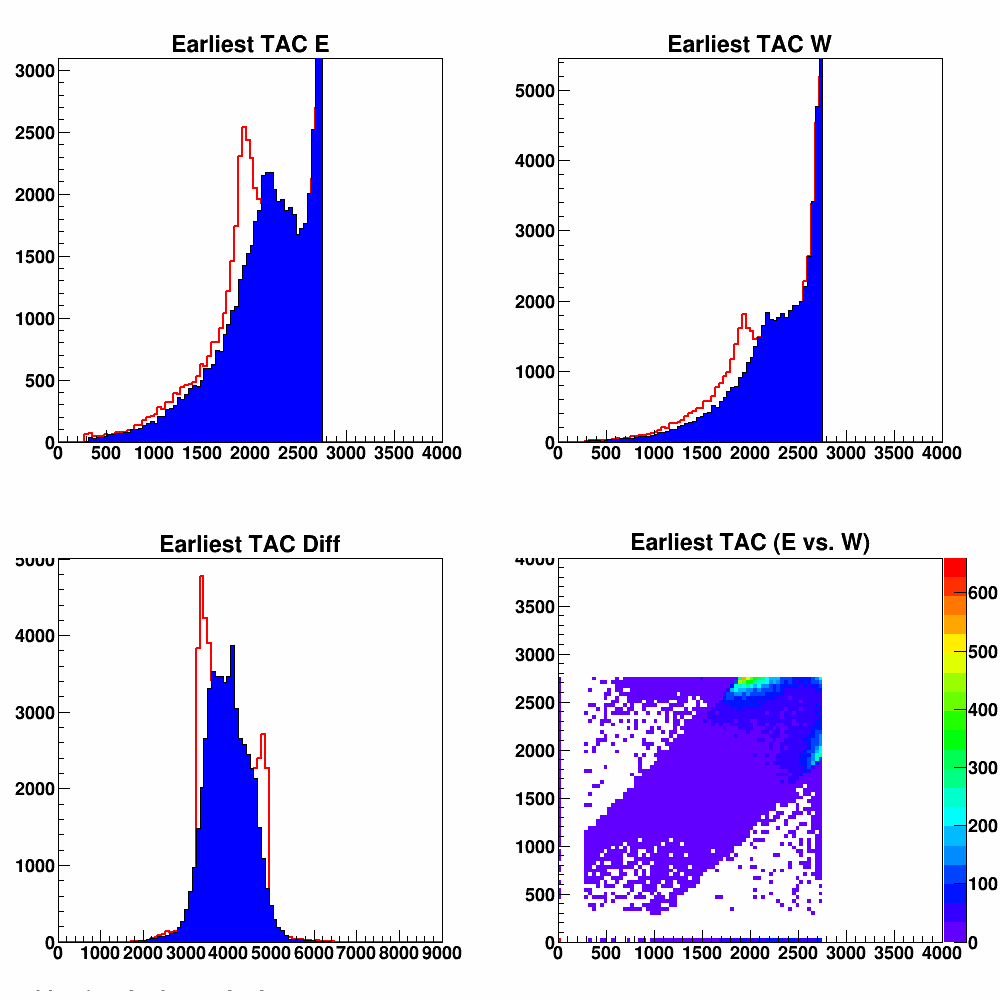

Figure 1: TAC distributions for the EPD for run 22069040 and the associated vertex XY position.
The timing settings for this run are:
EPD_QTc_W_TAC_Max 2750
EPD_QTc_W_TAC_Min 300
EPD_QTc_E_TAC_Max 2750
EPD_QTc_E_TAC_Min 300
EPD_TACdiff_max 4928
EPD_TACdiff_min 3262
The EPD makes up 99% of the minbias-hlt70 trigger (though it should be noted that the vpd is 70%).
Ideally what we would see is a single bright spot that is about the same TAC East as TAC West. We don't see that there..... Instead there are the two bright spots on either side of the edge - and it's not clear what we are looking at here. Beam satelites perhaps? But it is clear that most events in this sample are good gold-gold events - so why is the distribution so strange looking?
- rjreed's blog
- Login or register to post comments