Fiber Polishing Averages
The question is, how do we know whether a given fiber is "good" enough. The issue is that there is some systematic in our test set up due to the geometry, which means that the absolute value of a given fiber as compared to another fiber isn't necessarily indicative that one fiber is better than another. (In fact, it is difficult to polish any fiber differently than any other, so outside of scratches they should be similar.)
Fiber bundles are declared good if their transmission loss is better than 65%, with no single fiber worse than 85%.
First we can look at the transmission of a given fiber for all tests (this includes bundles that did not pass) and for that fiber for all passing bundles.
An example from fiber 1 is:
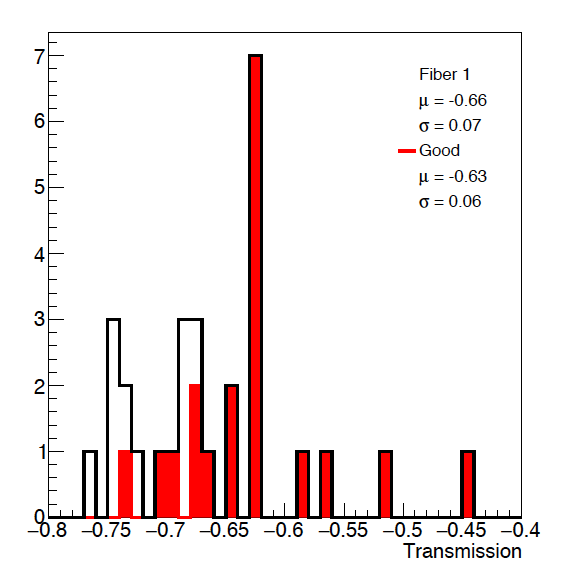
Figure 1: The transmission of fiber #1 for all tests (in black) and for tests where the bundle has passed (n red). We see here that in general, there is improvement for all fibers.
The summary for each fiber can be found at: drupal.star.bnl.gov/STAR/system/files/FBtestgood12122017.pdf
We can compare the averages + RMS of all the tests and the good tests at:
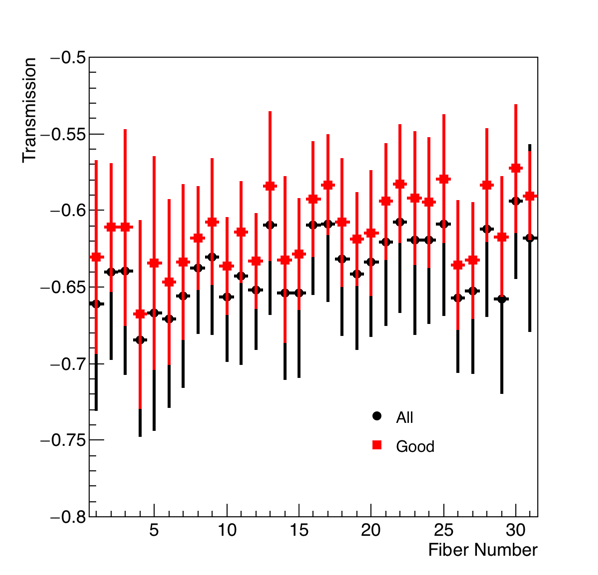
Figure 2: Average signal per bundle for all tests (black) and tests where the bundle has passed (red). Error bars are the RMS of the individual distribution. The structure can be seen in the different fibers, and it continues even for those that are good.
How should we normalize these distributions? I think that we can do this by subtracting the mean and dividing by the RMS. Thus they will be centered about 0, with a distribution in how many sigmas away a fiber is. We don't want to use the entire distribution for both the "all" test and the "good" test to do this, as our theory is that the good bundles are generally relatively consistent with one another so we will use the mean and average of the good sample to look at both.
We can look at what this did for fiber bundle 1:
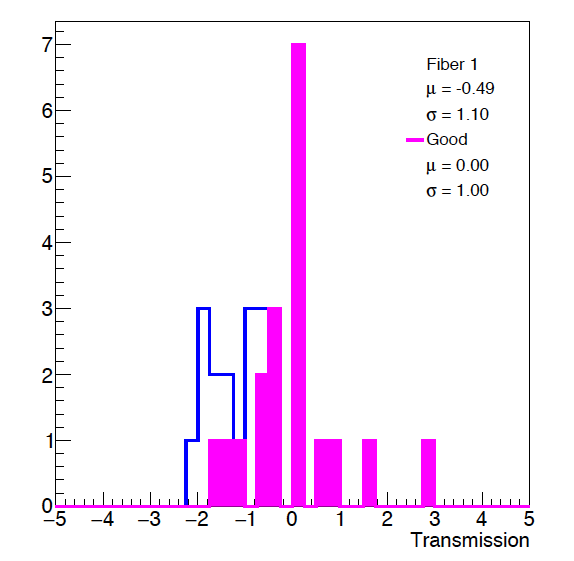
Figure 3: The transmission of fiber #1 for all tests (in blue) and for tests where the bundle has passed (in purple), normalized by the average and rms of the good bundles. We see here that in general, there is improvement for all fibers. By definition, there will always be some fibers with a value less than 0.
The distribution for all fibers can be seen at: drupal.star.bnl.gov/STAR/system/files/FBtestnorm2_12122017.pdf
Checking the normalization, we see:

Figure 4: Normalized transmission fiber by fiber for good bundles in red and all bundles in black, normalization checks out.
- rjreed's blog
- Login or register to post comments