Landau Functions
Trying to understand why fitting with nMip>2 seems to not work….
I ripped out just the definition part of Mike’s fitting routine:
#define nMipsMax 1 // what is the maximum number of MIPs you want to consider?
TF1* MipPeak[nMipsMax];
Double_t myfunc(Double_t* x, Double_t* param);
void DrawFunc(){
int xlo = 30; int xhi = 500;
TF1* func = new TF1("MultiMipFit",myfunc,xlo,xhi,nMipsMax+2);
func->SetLineColor(1);
MipPeak[0] = new TF1("1MIP","TMath::Landau(x,[0],[1],1)",xlo,xhi);
for (Int_t nMIP=2; nMIP<=nMipsMax; nMIP++){
TF1Convolution* c = new TF1Convolution(MipPeak[nMIP-2],MipPeak[0],xlo,xhi,true);
MipPeak[nMIP-1] = new TF1(Form("%dMIPs",nMIP),c,xlo,xhi,2*nMIP);
}
for (Int_t nmip=0; nmip<nMipsMax; nmip++){
func->SetParName(nmip,Form("%dMIPweight",nmip+1));
}
func->SetParName(nMipsMax,"MPV");
func->SetParName(nMipsMax+1,"WIDbyMPV");
func->SetParameter(nMipsMax+1,0.15);
func->SetParameter(nMipsMax,120);
for (int i = 0;i<nMipsMax;i++){
func->SetParameter(i,1);
}
func->Draw();
int colors[] = {2,4,6,kGreen+2,2,4,6,kGreen+2,2,4,6,kGreen+2,2,4,6,kGreen+2};
for (int i = 0;i<nMipsMax;i++){
MipPeak[i]->SetLineColor(colors[i]);
MipPeak[i]->Draw("same");
}
}
Double_t myfunc(Double_t* x, Double_t* param){
// parameters 0...(nMipsMax-1) are the weights of the N-MIP peaks
// and the last two parameters, index nMipsMax and nMipsMax+1,
// are single-MIP MPV and WID/MPV, respectively
Double_t ADC = x[0];
Double_t SingleMipMPV = param[nMipsMax];
Double_t WID = SingleMipMPV*param[nMipsMax+1];
Double_t fitval=0.0;
for (Int_t nMip=0; nMip<nMipsMax; nMip++){
Double_t Weight = abs(param[nMip]);
for (Int_t imip=0; imip<2*(nMip+1); imip+=2){
MipPeak[nMip]->SetParameter(imip,SingleMipMPV);
MipPeak[nMip]->SetParameter(imip+1,WID);
}
fitval += Weight*(*MipPeak[nMip])(ADC);
}
return fitval;
}
So when I run this, I get:
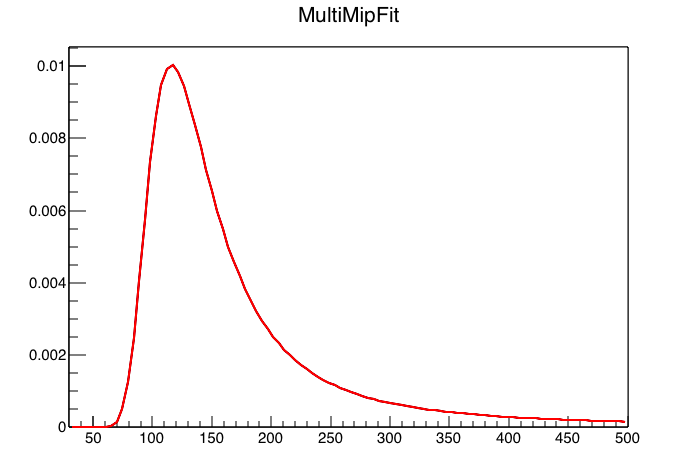
Figure 1: Code above run with 1 MIP peak, which makes it essentially a landau. All good.

Figure 2: Code above run for 2 MIP peaks. Already we can see something a little strange, I set the 1 Mip MPV = 120, so we would expect the 2 Mip MPV = 240, but from the blue curve we can clearly see that it is more like 250 or so. And there is that weird low side tail.
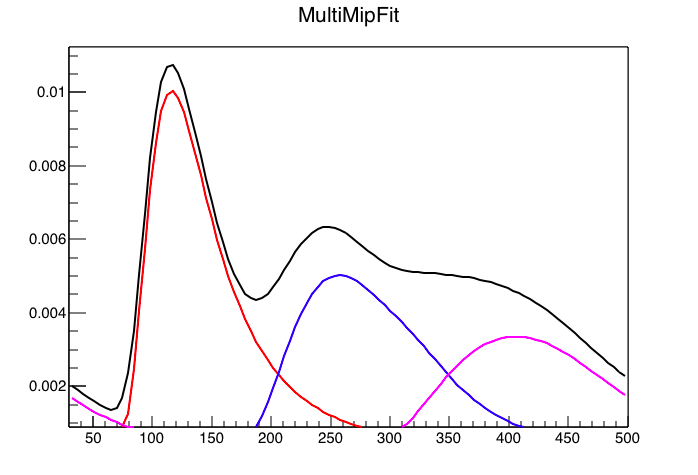
Figure 3: Code above run for 3 mip peaks.... We would expect 3 Mip MPV = 360, and it is clearly more like 400. We also see that weird tail.
The issue of the weird lowside tail effects the fit to the data.
Let's do the same thing fitting the data.

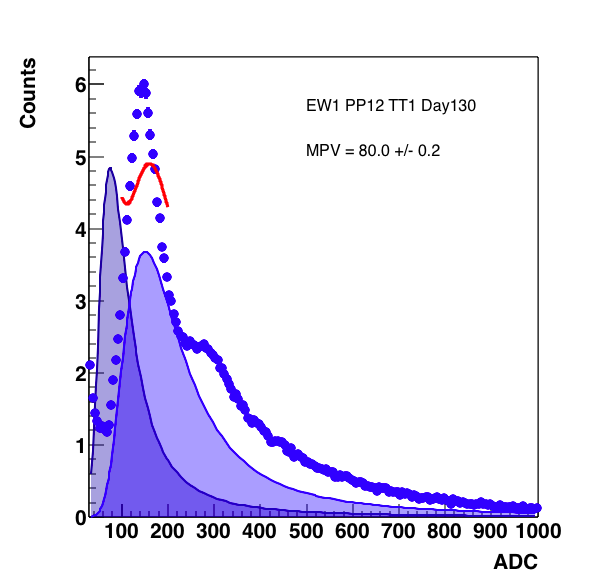
Figure 4: One MIP fit on the left, two MIP fit on the right. The addition of the second peak really borked the fit, but the fit range was only from 70 - 200, if I believe 145, then the 2nd peak should be about 290 which isn't in the fit.
1 Mip Fit:
FCN=160.277 FROM MIGRAD STATUS=CONVERGED 174 CALLS 175 TOTAL
EDM=5.99006e-08 STRATEGY= 1 ERROR MATRIX ACCURATE
EXT PARAMETER STEP FIRST
NO. NAME VALUE ERROR SIZE DERIVATIVE
1 1MIPweight 8.82128e+02 6.54928e+00 5.43840e-05 -4.17695e-03
2 MPV 1.45558e+02 2.79522e-01 7.93251e-05 -1.79544e-02
3 WIDbyMPV 1.88606e-01 1.66946e-03 8.14215e-05 1.58868e-02
2 mip fit
FCN=2758.07 FROM MIGRAD STATUS=CONVERGED 200 CALLS 201 TOTAL
EDM=4.94458e-09 STRATEGY= 1 ERROR MATRIX UNCERTAINTY 3.2 per cent
EXT PARAMETER STEP FIRST
NO. NAME VALUE ERROR SIZE DERIVATIVE
1 1MIPweight 5.35377e+02 4.85739e+00 2.00087e-03 -3.58158e-06
2 2MIPweight 8.14176e+02 5.60965e+00 -4.91588e-03 2.43227e-06
3 MPV 8.00000e+01 5.33183e-03 2.48233e-05** at limit **
4 WIDbyMPV 2.50000e-01 2.57808e-04 1.77609e-04** at limit **


Figure 5: 2 MIP fit on the left, 3 MIP on the right. The range had been expanded from 70 - 350. We see a similar effect when we add the 3rd peak which would not be under this range.
FCN=282.267 FROM MIGRAD STATUS=CONVERGED 178 CALLS 179 TOTAL
EDM=1.02559e-07 STRATEGY= 1 ERROR MATRIX ACCURATE
EXT PARAMETER STEP FIRST
NO. NAME VALUE ERROR SIZE DERIVATIVE
1 1MIPweight 8.33440e+02 3.56425e+00 1.92630e-02 -1.01343e-04
2 2MIPweight 3.52958e+02 3.30572e+00 2.50075e-02 1.74411e-05
3 MPV 1.44043e+02 2.16667e-01 8.38936e-05 1.66138e-02
4 WIDbyMPV 1.78066e-01 1.00953e-03 1.03020e-04 8.12900e-03
FCN=6017.2 FROM MIGRAD STATUS=CONVERGED 284 CALLS 285 TOTAL
EDM=1.68328e-08 STRATEGY= 1 ERROR MATRIX UNCERTAINTY 1.5 per cent
EXT PARAMETER STEP FIRST
NO. NAME VALUE ERROR SIZE DERIVATIVE
1 1MIPweight 6.10726e+02 4.71039e+00 -7.22836e-03 1.89145e-05
2 2MIPweight 6.26405e+02 4.86516e+00 3.31741e-03 8.17140e-05
3 3MIPweight 1.36608e+02 5.03761e+00 -5.94332e-03 7.68532e-05
4 MPV 8.00000e+01 5.47914e-03 1.36022e-05** at limit **
5 WIDbyMPV 2.50000e-01 1.33540e-04 -8.06325e-06** at limit **

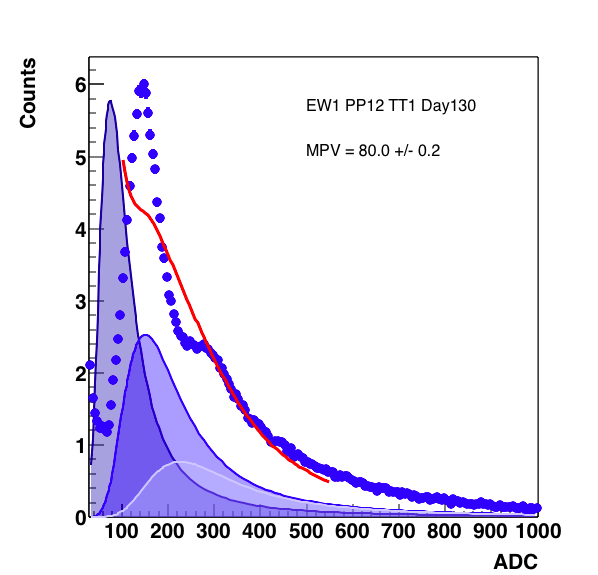
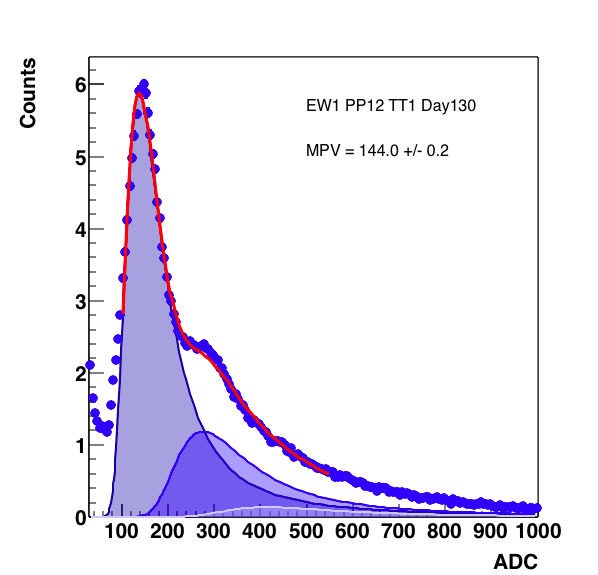
Figure 6: 3 MIP peak with the fit from 70 - 500 on the right, as shown below the 3rd peak comes in with a negative weight. On the right, the expansion to 70 - 550 still does not help (though now the weight of the 3rd peak is not negative). On the right, forcing the positive definite value for the weight gives something reasonable. Note below, this does not cause the fit to slam against the constraint.
FCN=373.043 FROM MIGRAD STATUS=CONVERGED 302 CALLS 303 TOTAL
EDM=6.96247e-08 STRATEGY= 1 ERROR MATRIX ACCURATE
EXT PARAMETER STEP FIRST
NO. NAME VALUE ERROR SIZE DERIVATIVE
1 1MIPweight 8.35021e+02 3.62410e+00 2.18632e-02 1.77576e-05
2 2MIPweight 3.38673e+02 2.95924e+00 1.96485e-02 -4.04507e-05
3 3MIPweight -5.05797e+01 4.26320e+00 3.03396e-02 -2.22812e-05
4 MPV 1.43955e+02 2.17057e-01 9.10175e-05 -2.14711e-02
5 WIDbyMPV 1.78387e-01 1.03556e-03 1.18692e-04 -1.58109e-02
FCN=7201.61 FROM MIGRAD STATUS=CONVERGED 248 CALLS 249 TOTAL
EDM=1.04699e-09 STRATEGY= 1 ERROR MATRIX ACCURATE
EXT PARAMETER STEP FIRST
NO. NAME VALUE ERROR SIZE DERIVATIVE
1 1MIPweight 6.38993e+02 4.75400e+00 1.45672e-01 1.25899e-05
2 2MIPweight 5.60448e+02 4.59808e+00 1.00474e-01 8.38709e-06
3 3MIPweight 2.54464e+02 3.45316e+00 9.26723e-02 1.08419e-06
4 MPV 8.00000e+01 2.37402e-02 1.52618e-03** at limit **
5 WIDbyMPV 2.50000e-01 3.90788e-05 1.49572e-03** at limit **
FCN=384.336 FROM MIGRAD STATUS=CONVERGED 292 CALLS 293 TOTAL
EDM=2.8685e-07 STRATEGY= 1 ERROR MATRIX ACCURATE
EXT PARAMETER STEP FIRST
NO. NAME VALUE ERROR SIZE DERIVATIVE
1 1MIPweight 8.35386e+02 3.62999e+00 5.97342e-05 4.20880e-02
2 2MIPweight 3.36422e+02 2.86579e+00 4.07452e-05 -3.81219e-02
3 3MIPweight 5.84023e+01 3.20516e+00 9.77948e-05 1.77597e-02
4 MPV 1.43960e+02 2.17037e-01 9.13564e-05 -5.14115e-02
5 WIDbyMPV 1.78444e-01 1.03854e-03 1.19917e-04 9.53927e-03
Further addition of peaks doesn't really change anything... So really, 2 peaks are probably sufficient for this multiplicity.

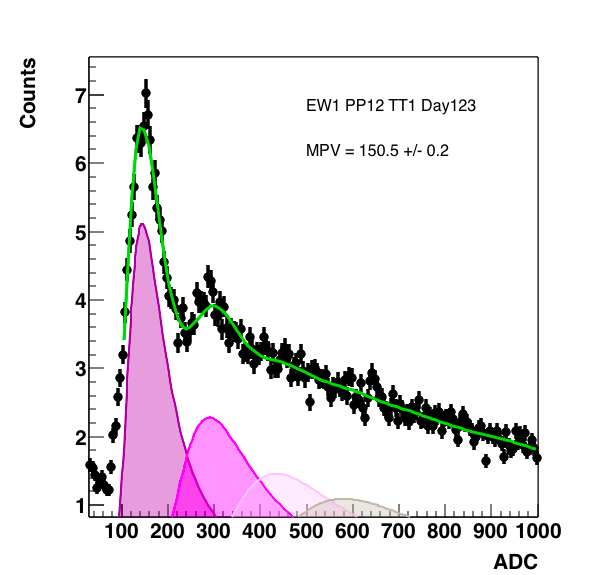

Figure 7: Right is Au 27 GeV, Middle is Isobar, and the right is a comparison. All fits were done with 6 mip peaks, as this was the minimum needed to fit the entire range.
FCN=458.59 FROM MIGRAD STATUS=CONVERGED 561 CALLS 562 TOTAL
EDM=8.83761e-09 STRATEGY= 1 ERROR MATRIX UNCERTAINTY 3.4 per cent
EXT PARAMETER STEP FIRST
NO. NAME VALUE ERROR SIZE DERIVATIVE
1 1MIPweight 8.28828e+02 3.92152e+00 1.49190e-06 9.00705e-03
2 2MIPweight 3.36404e+02 3.01041e+00 -4.82824e-06 -2.62533e-02
3 3MIPweight 4.89192e+01 3.60094e+00 -7.92590e-06 -1.23139e-02
4 4MIPweight 5.30571e+01 4.76019e+00 1.12367e-05 -1.20153e-04
5 5MIPweight 6.04149e+00 6.61719e+00 -9.03286e-05 2.94519e-03
6 6MIPweight 6.45833e+00 8.35843e+00 1.19125e-04 6.28306e-04
7 MPV 1.43967e+02 2.16730e-01 1.56419e-06 -2.30147e-02
8 WIDbyMPV 1.77948e-01 1.04250e-03 -3.21499e-06 -8.19867e-03
FCN=229.09 FROM MIGRAD STATUS=CONVERGED 826 CALLS 827 TOTAL
EDM=1.30308e-08 STRATEGY= 1 ERROR MATRIX UNCERTAINTY 2.5 per cent
EXT PARAMETER STEP FIRST
NO. NAME VALUE ERROR SIZE DERIVATIVE
1 1MIPweight 7.18792e+02 1.64856e+01 -3.28006e-05 8.50629e-03
2 2MIPweight 6.41400e+02 1.68860e+01 -1.65368e-05 8.36293e-03
3 3MIPweight 6.15045e+02 1.52949e+01 -1.12703e-05 6.57146e-03
4 4MIPweight 6.13597e+02 2.38323e+01 1.55258e-05 2.84052e-03
5 5MIPweight 4.89799e+02 4.42071e+01 -6.37544e-05 4.15995e-03
6 6MIPweight 5.66119e+02 7.61118e+01 1.20142e-04 4.50678e-03
7 MPV 1.50521e+02 6.35314e-01 6.63024e-06 2.39181e-03
8 WIDbyMPV 1.68688e-01 2.63203e-03 -4.31418e-05 -3.60866e-03
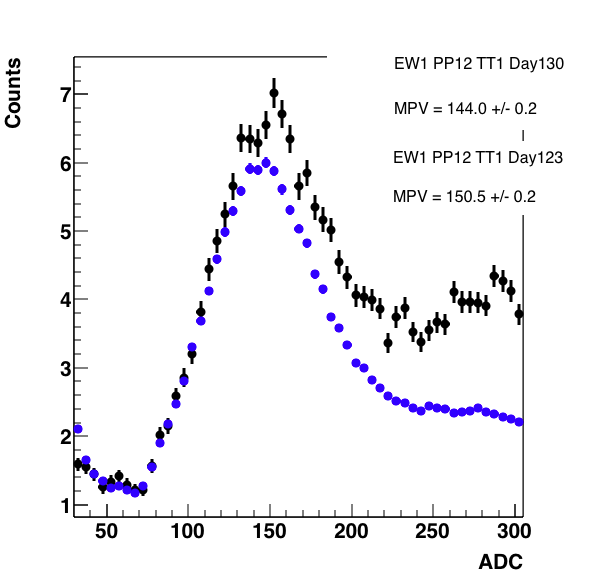
Figure 8: Comparison from figure 7 without fits. Note, I have scaled everything to pin the curves together at 125.
Ok, let me try to understand this:
TF1* func = new TF1("MultiMipFit",myfunc,xlo,xhi,nMipsMax+2);
func->SetLineColor(1);
MipPeak[0] = new TF1("1MIP","TMath::Landau(x,[0],[1],1)",xlo,xhi);
for (Int_t nMIP=2; nMIP<=nMipsMax; nMIP++){
TF1Convolution* c = new TF1Convolution(MipPeak[nMIP-2],MipPeak[0],xlo,xhi,true);
MipPeak[nMIP-1] = new TF1(Form("%dMIPs",nMIP),c,xlo,xhi,2*nMIP);
}
Let's say nMipsMax = 4...
So the first loop, nMIP = 2, thus TF1Convolution* c = new TF1Convolution(MipPeak[nMIP-2],MipPeak[0],xlo,xhi,true); = TF1Convolution* c = new TF1Convolution(MipPeak[0],MipPeak[0],xlo,xhi,true); -> Convolutes the 2 landau distributions together, so ok, this is precisely the same.
Then MipPeak[1] = new TF1(Form("%dMIPs",nMIP),c,xlo,xhi,2*nMIP) -> This confuses me ... So the functional call is the convolution of 2 identical 1 mip Landaus? I don't quite understand.
- rjreed's blog
- Login or register to post comments