New 7.7 GeV Data EPD perspective
I have analyzed 14261 collisions from runs 20154025,26,27,28,29,30,31,32,33,35,38,40,45,46 taken the first day we had 7.7 GeV Data.
Looking at the distributions
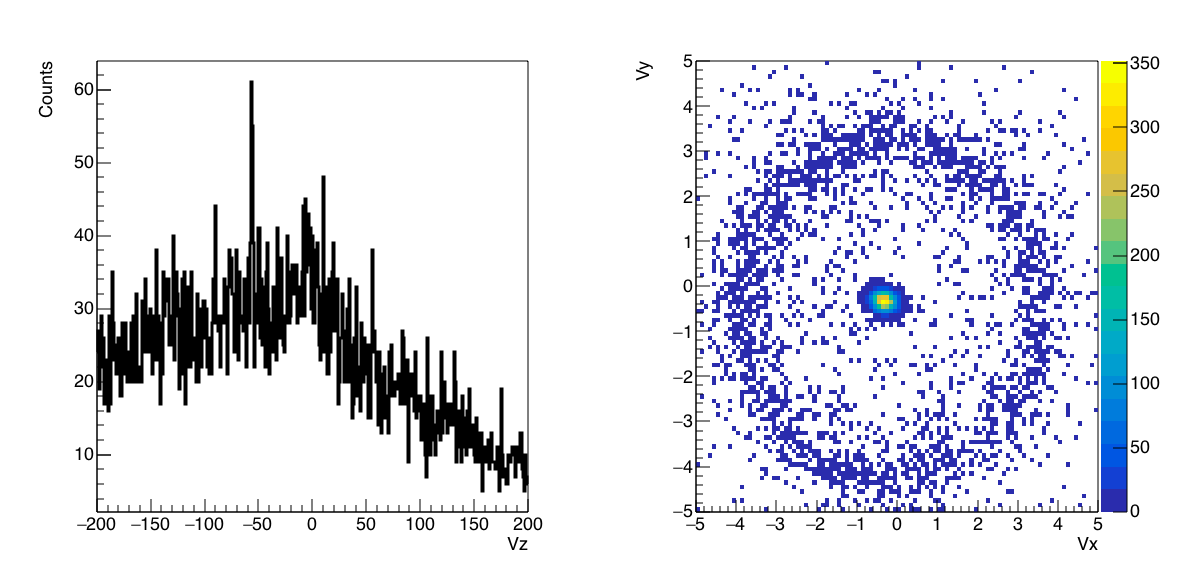
Figure 1: (Left) Vz distribution (highest ranked vertex for all reconstructed vertices). (Right) Vx vs Vy.
This actually looks pretty clean! I know we opened the TAC window and thus the Vz, but it might be good to shift it inward a little as the Vz distribution is quite broad.
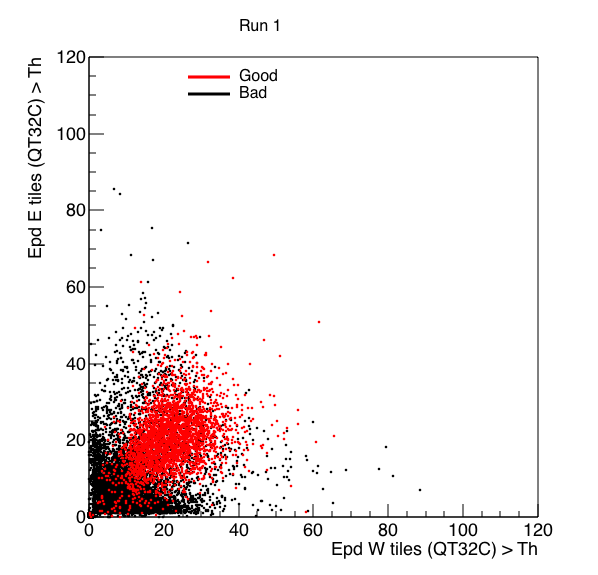
Figure 2: Good vs Bad events in terms of EPD multiplicity
Figure 2 is extremely promising, good events are defined as those with |Vz|<70 and |Vx|<1 and |Vy<1, whereas bad events are those without a vertex or those where the vertex is |Vx|>1 or |Vy| > 1.
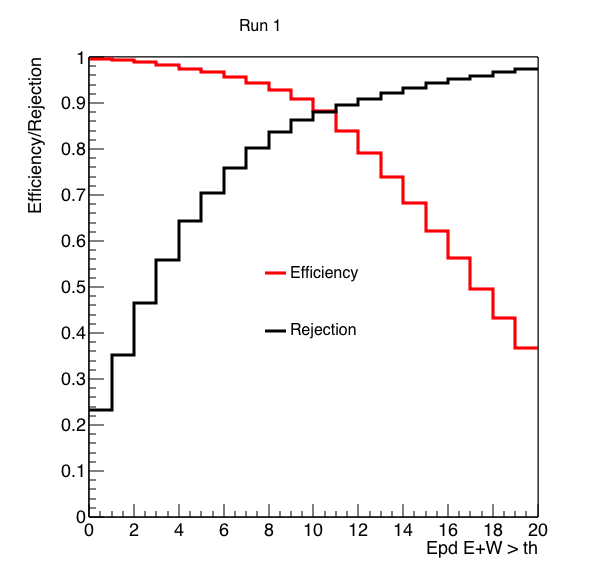
Figure 3: Efficiency (red) vs Rejection (black) vs EPD tiles above threshold.
We see from Figure 3 that a cut of >0, >1 or >2 all have very high efficiency and an increasing rejection rate. If the >0 threshold works in terms of the bandwidth, then that should be fine.
- rjreed's blog
- Login or register to post comments